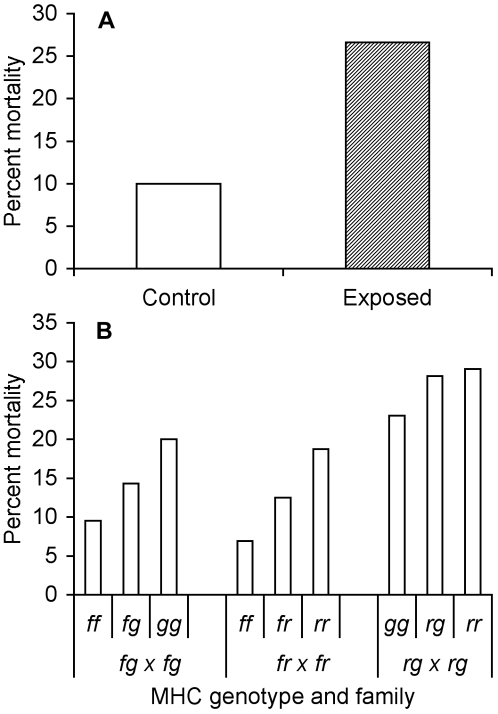
Figure 4. Mortality as a function of bacterial exposure and MHC genotype within families.(A) Percent mortality of tadpoles exposed to live (exposed) and heat-killed (control) A. hydrophila. N = 120 for each treatment. (B) Percent mortality of tadpoles with each MHC genotype from 3 different families. Sample sizes differed among families; see Table 1.
Image published in: Barribeau SM et al. (2008)
Barribeau et al. Creative Commons Attribution license
Permanent Image Page
Printer Friendly View
XB-IMG-123088