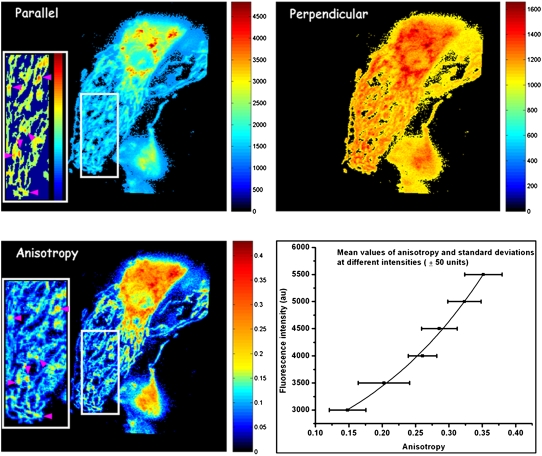
FIGURE 2. Distribution of polarization-resolved fluorescence intensities and corresponding anisotropy values of DASPMI-stained XTH2 cells. The very distinct high anisotropy at high-intensity regions (inserts) inside several individual mitochondria is apparent. Such submitochondrial zones of higher membrane potential are known to exist from previous studies in XTH2 cells. The plot of mean anisotropy values and corresponding pixel fluorescence intensities (± 50 units) were fitted to an exponential function of the form
Image published in: Ramadass R and Bereiter-Hahn J (2008)
Copyright © 2008, Biophysical Society. Creative Commons Attribution-NonCommercial license
Permanent Image Page
Printer Friendly View
XB-IMG-123313