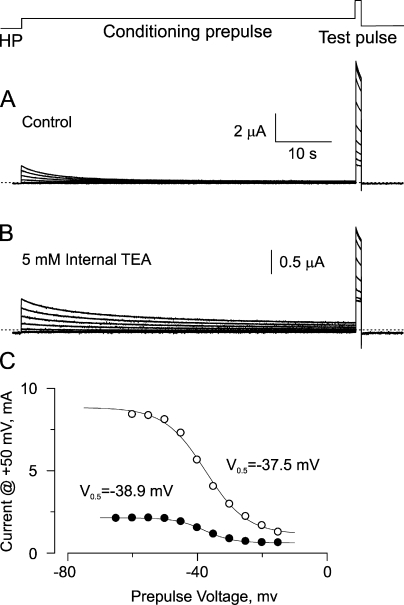
Figure 9. Voltage dependence of Shaker IR channel availability in the presence of internal TEA. (A) Ionic currents in the absence of TEA elicited using the protocol schematized at the top of Fig. 2 in COVC. (B) Similar traces obtained after 40 min of diffusional perfusion of internal 5 mM TEA. (C) Comparison of the peak current amplitude at the test voltage pulse for the control traces shown in A (open circles) and after the 40-min perfusion of TEA traces in B (filled circles). The continuous lines are fits to a Boltzman distribution function with the half inactivation voltages depicted in the figure using an effective valence of z = −4.6 eo for the control traces and z = −5.81 eo for the traces with TEA. The holding voltage was −90 mV. Discontinuous lines in A and B indicate zero current level.
Image published in: González-Pérez V et al. (2008)
© 2008 González-Pérez et al. Creative Commons Attribution-NonCommercial-ShareAlike license
Permanent Image Page
Printer Friendly View
XB-IMG-123458