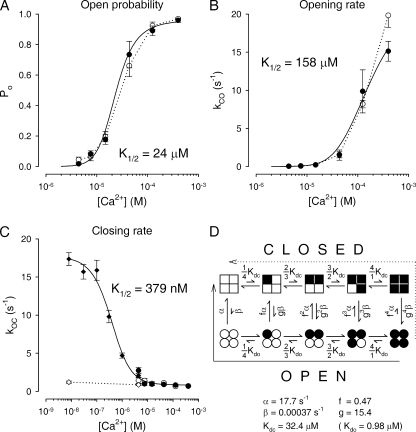
Figure 5. [Ca2+]i dependence of TRPM2 single-channel gating parameters is well described by the MWC model. (A–C) Steady-state (mean ± SEM) open probabilities (Po; A), opening rates (kCO; B), and closing rates (kOC; C) of single TRPM2 channels at ≥4.4 µM Ca2+ are plotted (circles) as a function of [Ca2+]i. In C, diamonds represent closing rates at ≤4.4 µM Ca2+ determined from macroscopic current decay time courses. Pipette [Ca2+] was either ∼4 µM (closed circles) or 1 mM (open circles and dotted lines). Solid black lines illustrate the fit of the data at low extracellular Ca2+ (closed circles) by the scheme in D. (D) MWC model with four Ca2+-binding sites (1 site/subunit). Squares represent closed and circles represent open channel subunits; filled black symbols represent subunits with Ca2+ bound. Solid and dotted arrow indicate the pathways of channel closure upon rapid removal of intracellular Ca2+ in the absence and presence, respectively, of extracellular Ca2+.
Image published in: Csanády L and Törocsik B (2009)
© 2009 Csanády and Törőcsik. Creative Commons Attribution-NonCommercial-ShareAlike license
Permanent Image Page
Printer Friendly View
XB-IMG-123582