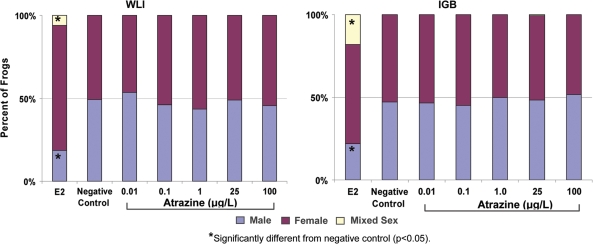
FIG. 3. Proportion of frogs (%) that were histologically determined to be male, female, or mixed sex. Statistical difference are marked by asterisk *p < 0.05.
Image published in: Kloas W et al. (2009)
Image downloaded from an Open Access article in PubMed Central. © The Author 2008. Published by Oxford University Press on behalf of Japanese Society of Plant Physiologists. All rights reserved.
Permanent Image Page
Printer Friendly View
XB-IMG-123610