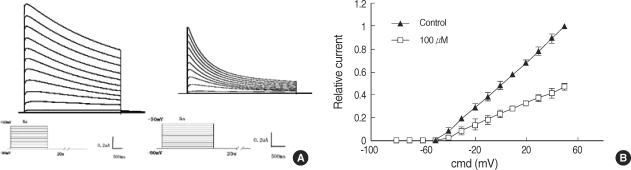
Fig. 1. Current-voltage relationship of fkv1.4ΔN currents under control condition (CTRL; filled symbols) and propafenone (open symbols; 100 µM/L PROP). Xenopus oocytes with all covering tissues. (A) original recordings, (B) current-voltage relationships of currents at the end of the voltage step. The symbols represent means±SEM of 14 experiments. Voltage steps were elicited from the holding potential of -80 mv to potential up to +50 mv. The currents were normalized to the respective maximal current amplitude under control condition (I current, U voltage).
Image published in: Wang Z et al. (2009)
Copyright © 2009 The Korean Academy of Medical Sciences. Creative Commons Attribution-NonCommercial license
Permanent Image Page
Printer Friendly View
XB-IMG-123642