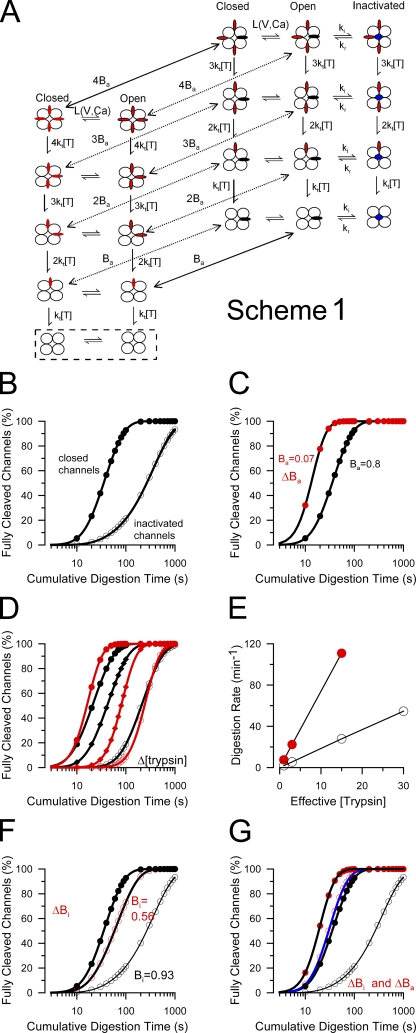
Figure 2. Stochastic model for protection of β2 N termini from digestion by trypsin. (A) A kinetic scheme describing the proposed digestion of β2 N termini by trypsin is shown, including channel gating (L(V, Ca)), protection of N termini within the antechamber (P), and inactivation. States highlighted in the box are those in which inactivation has been completely removed by trypsin. Flattened red ovoids correspond to N termini in positions outside the antechamber, while, when black, are within the antechamber. Blue circles on the axes of the pore correspond to an N terminus in an inactivation position. (B–G) Simulated digestion time courses based on this scheme. (B) The simulated digestion time courses are shown for parameters given in Table II for closed-channel conditions (Po = 0.01) or inactivating conditions (Po = 0.99; Bi = 0.93). The fit of Eq. 1 to the time course under closed-channel conditions yielded τd = 28.5 s (n = 2.09). Under inactivating conditions, τd = 327.3 s (n = 1.17). (C) The affinity of the N terminus for the site involved in closed-channel protection (affinity for antechamber, Ba) was reduced by increasing the dissociation rate from the site 50-fold. Under these conditions (red circles), τd = 7.2 s (n = 3.98). (D) The effective digestion rate was varied (approximating changes in [trypsin] [black symbols]) for closed-channel conditions as defined in A and for the case that antechamber binding affinity is reduced (red symbols). With reduced antechamber binding affinity, the slope of the digestion time course is steeper, but the slope is unaffected by the effective rate of the digestion process. (E) The effective digestion rates are plotted as a function of effective trypsin concentration for the cases of modest closed-channel protection (open circles) or without such closed-channel protection (red circles). The slope of the lines shows the approximately fourfold difference in effective digestion rate that arises because of the difference of occupancy in the antechamber, despite the fact that the same underlying molecular rate for the cleavage step was used in the two cases. (F) The effect of weakening the affinity of the inactivation domain for the channel pore (ΔBi) is illustrated. The rate of dissociation of the inactivation domain from its blocking position was increased 10-fold, changing steady-state inactivation from 0.93 to 0.56. In this case, under inactivating conditions, the digestion time course (red circles) approaches that observed for closed-channel conditions (solid black circles) with τd = 55.8 s (n = 1.63), whereas under there is no difference between the two cases for closed-channel conditions (not depicted). (G) The effect of a fivefold weakening of both binding in the antechamber (Ba) and at the inactivation site (Bi) is shown. This alters digestion both under closed-channel conditions (solid symbols; τd = 11.1 s; n = 3.43) and under inactivated conditions (open symbols; τd = 21.7 s; n = 2.45). Values for simulations and resulting measurements of τd and n are given in Table II.
Image published in: Zhang Z et al. (2009)
© 2009 Zhang et al. Creative Commons Attribution-NonCommercial-ShareAlike license
Permanent Image Page
Printer Friendly View
XB-IMG-123676