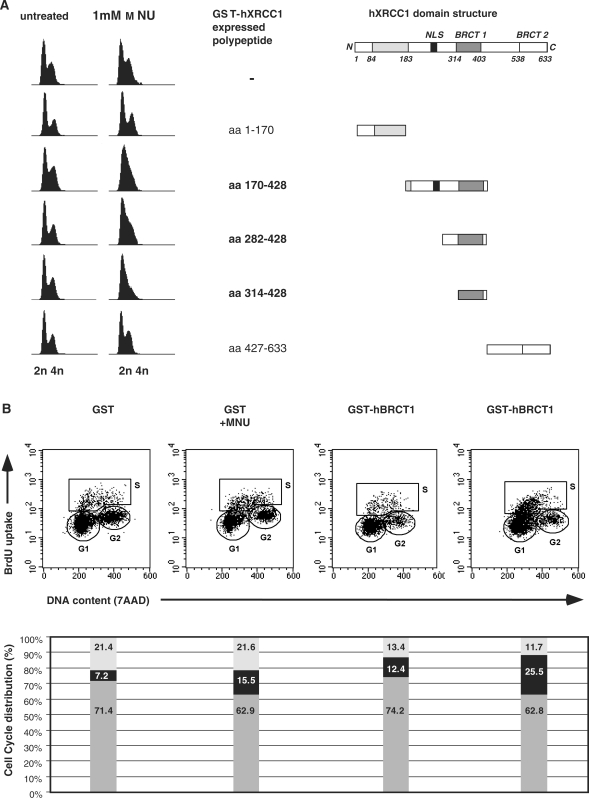
Figure 5. GST-hXRCC1-BRCT1 overexpressing cells accumulate in S phase following DNA damage. (A) Cell cycle analysis (right) of HeLa cells overexpressing GST-tagged fragments of hXRCC1 (schematically represented on the right), treated by 1 mM MNU and analyzed 20 h after. (B) Flow cytometry profiles of BrdU incorporation (DNA synthesis) versus DNA content (7AAD fluorescence) of HeLa cells overexpressing either GST alone or GST-hXRCC1-BRCT1 20 h after treatment or not with 1 mM MNU.
Image published in: Lévy N et al. (2009)
© 2009 The Author(s). Creative Commons Attribution-NonCommercial license
Permanent Image Page
Printer Friendly View
XB-IMG-123907