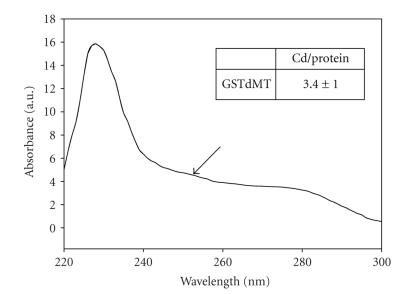
Figure 2. UV-visible absorption spectrum of GSTdMT at 2.7 mg/mL concentration in 20 mM HEPES buffer at pH 8.0. The charge transfer band between 240 and 260 nm due to Cd-S interaction is indicated by the arrow. The Cd/protein ratio is given in the inset.
Permanent Image Page
Printer Friendly View
XB-IMG-124122