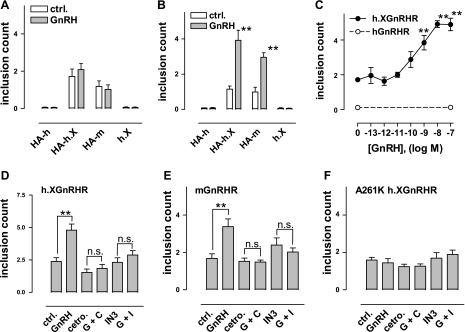
Fig. 6. Agonist-induced redistribution of HA-GnRHR. A and B: HeLa cells transduced with HA-tagged hGnRHR, h.XGnRHR, or mGnRHR or with nontagged h.XGnRHR as a negative control (HA-h, HA-h.X, HA-m, and h.X, respectively) were washed and incubated for 60 min at room temperature (â¼21°C) in medium with anti-HA (1:200). They were then washed and incubated for 15 min (A) or 60 min (B) at 37°C in medium with 0 or 10â7 M GnRH as indicated before being processed for determination of inclusion count, as above. GnRH effects were only statistically significant (**P < 0.01 compared with corresponding control) after 60 min in cells expressing HA-h.XGnRHR or HA-mGnRHR. C: HeLa cells transduced with HA-h.XGnRHR (â) or HA-hGnRHR (â) were loaded with primary Ab as above, then washed and incubated for 60 min at 37°C in medium with the indicated concentration of GnRH. DâF: HeLa cells transduced with HA-h.XGnRHR, HA-mGnRHR, or HA-A261K h.XGnRHR were prepared and loaded with anti-HA as above, before being washed and incubated for 60 min at 37°C in medium with no addition (CTRL), GnRH (10â9 M), cetrorelix (Cetro; 10â7 M), IN3 (10â7 M), or with GnRH plus cetrorelix (G + C) or GnRH plus IN3 (G + I) as indicated. In all cases, incubations were terminated by washing at 4°C and cells were then processed to determine the inclusion count, as described in materials and methods. The data shown are means ± SE (n = 3 or 4) pooled from 3 or 4 separate experiments (each with 2â4 replicate wells per treatment). ANOVAs revealed âtreatmentâ as a significant variable in AâE (but not in F). NS, not significant. **P < 0.01 compared with corresponding control without GnRH.
Image published in: Finch AR et al. (2009)
Image downloaded from an Open Access article in PubMed Central. Copyright © 2009 the American Physiological Society
Permanent Image Page
Printer Friendly View
XB-IMG-124224