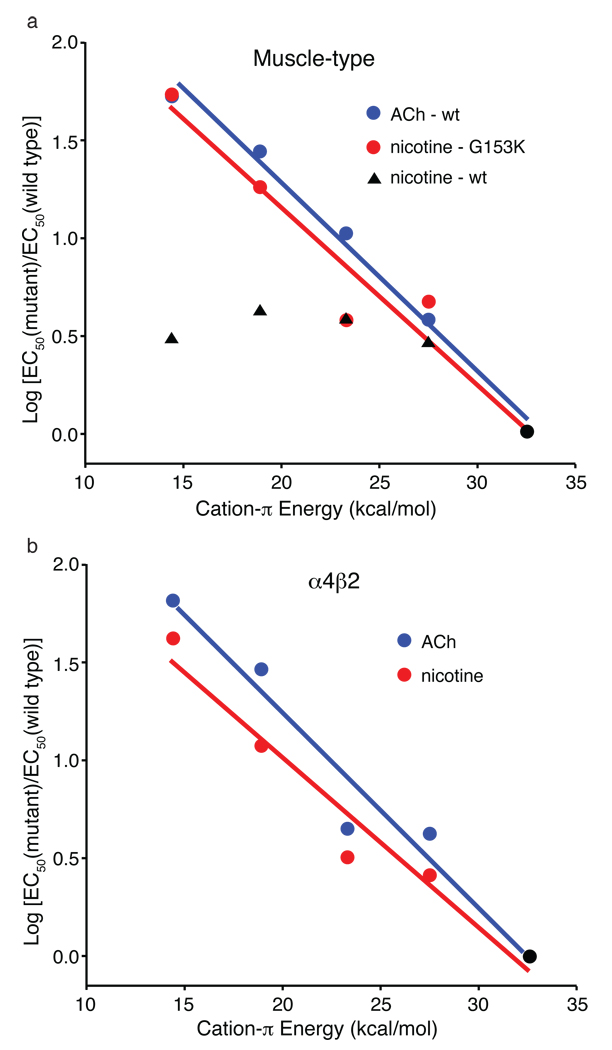
Figure 4. Fluorination plots. Note that in both plots, all data sets share the point at x = 32.6 kcal/mol (cation-π energy for Trp); y = 0 (black circle). Moving to the left then corresponds to monofluoro-, difluoro-, trifluoro- and tetrafluoro-TrpB. Cation-π binding energies (x-axes) are from 9. a. Muscle-type receptor. The designation “wt indicates G at position 153. b. α4β2 receptor.
Image published in: Xiu X et al. (2009)
Image downloaded from an Open Access article in PubMed Central. Image reproduced on Xenbase with permission of the publisher and the copyright holder.
Permanent Image Page
Printer Friendly View
XB-IMG-124257