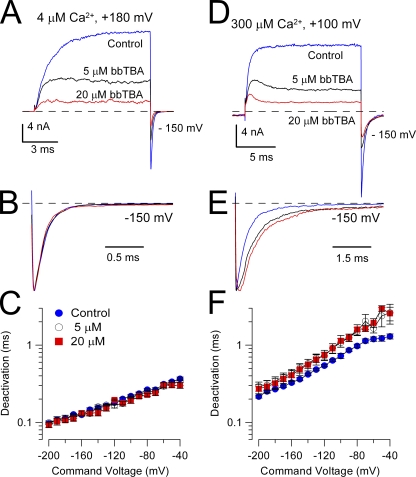
Figure 13. bbTBA causes slight tail current prolongation at higher Ca2+, but not at 4 µM Ca2+. (A) BK currents were activated by steps to +180 mV from a −100-mV holding potential with 4 µM of internal Ca2+. Both 5 (black) and 20 µM (red) cause appreciable reduction both in outward current at +180 mV and tail current at −150 mV. (B) Tail currents in A were normalized to the peak tail current amplitude showing no difference in time course. (C) Deactivation time constants are plotted as a function of tail current potential for control and 5- and 20-µM bbTBA conditions. (D) Currents were activated by steps to +100 mV with 300 µM of internal Ca2+, with tail current at −150 mV. (E) Tail currents in D were normalized to the peak current amplitude and the baseline for an exponential fitted to the decay phase, showing the slowing of deactivation and a slight hook of unblock in the current before deactivation. (F) The time constant of deactivation is plotted for the same three conditions as shown in C. The time constants in 5 and 20 µM bbTBA were indistinguishable from each other, but clearly were slowed relative to control time constants.
Image published in: Tang QY et al. (2009)
© 2009 Tang et al. Creative Commons Attribution-NonCommercial-ShareAlike license
Permanent Image Page
Printer Friendly View
XB-IMG-124331