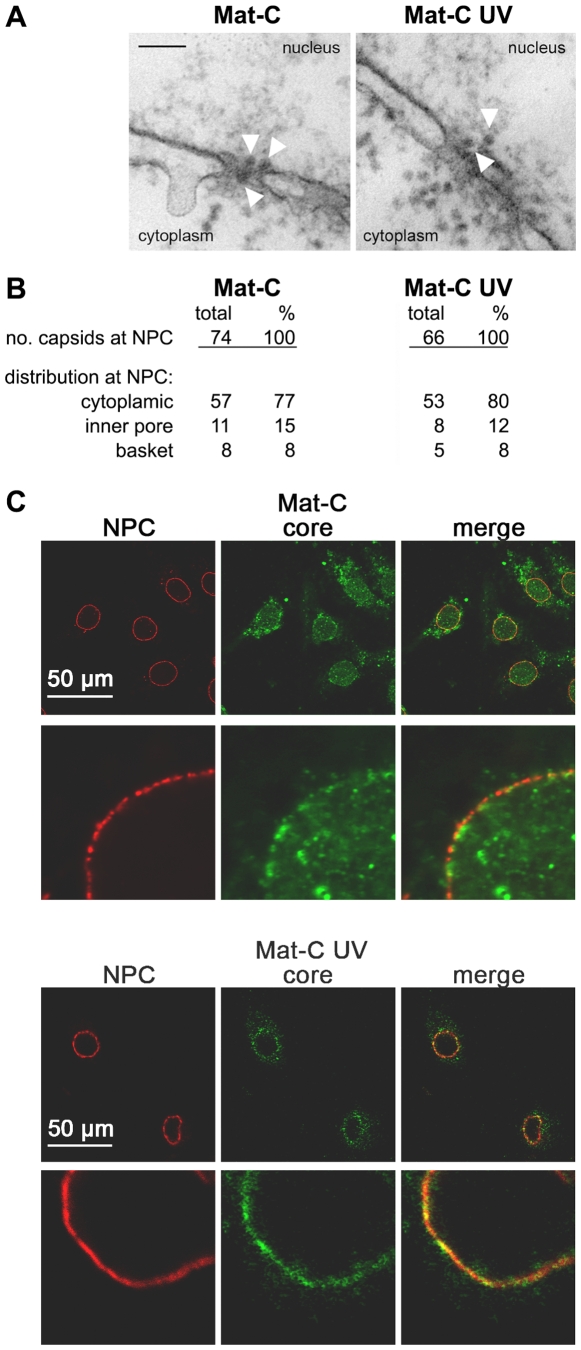
Figure 6. Nuclear transport of Mat-C and Mat-C-UV.A. Electron microscopy of the capsids at the NPCs after microinjection into the cytoplasm of Xenopus laevis oocytes. The white arrows indicate capsids. Black scale bar: 100 nm. B. Frequency of NPC-attached capsids and the capsid distribution at the NPCs. Both capsid species showed a similar frequency at the NPCs and similar importation into the nuclear basket. C. In vitro transport assays of the capsids in digitonin-permeabilized HuH-7 cells. NPCs (red) and capsids (green) are visualized by indirect immune stain. The merges are depicted on the right panels. The panels show overviews and strongly magnified images. While Mat-C (upper two panels) caused intranuclear fluorescence cross-linked capsids (lower two panels) failed to enter the karyoplasm.
Image published in: Schmitz A et al. (2010)
Schmitz et al. Creative Commons Attribution license
Permanent Image Page
Printer Friendly View
XB-IMG-124612