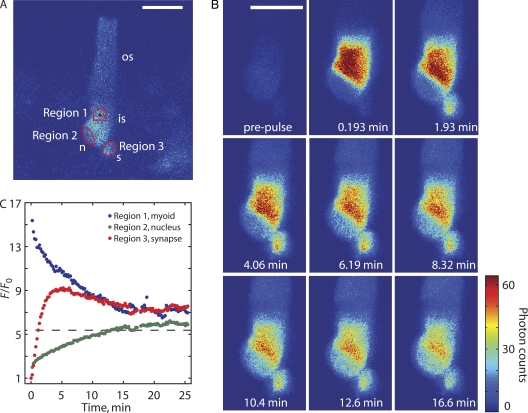
Figure 4. PAGFP diffusion in IS subcompartments. (A) The cell illustrated in Fig. 3 with fluorescence analayzed in the IS subcompartments indicated by red polygons. The red dot shows the site of PAGFP activation. (B) Selected images from the time series in Fig. 3 shown at a higher frequency and enlarged to reveal the dynamics of photoconverted PAGFP in the IS region. The color bar is relevant to images in B only. (C) Integrated fluorescence in each of the regions defined in A, normalized to the integrated fluorescence of the respective regions in the prepulse image. Dashed line indicates the expected equilibrium level (see Fig. 3), which will only be reached when the slowly equilibrating OS is finally at equilibrium. (A and B) Bar, 10 µm.
Image published in: Calvert PD et al. (2010)
© 2010 Calvert et al. Creative Commons Attribution-NonCommercial-ShareAlike license
Permanent Image Page
Printer Friendly View
XB-IMG-124732