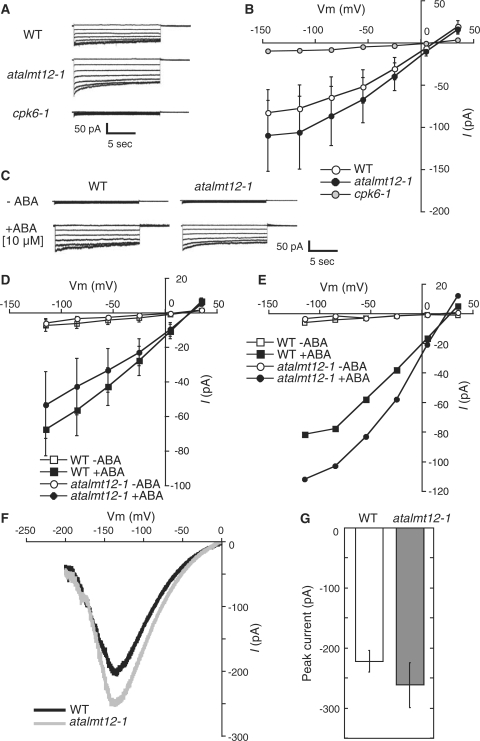
Fig. 6. S-type and R-type anion currents in A. thaliana guard cell protoplasts. (A, B) Whole-cell S-type anion currents in response to a high extracellular calcium concentration (40 mM CaCl2 in the bath solution). (A) Representative traces of calcium-activated S-type anion currents. (B) Current–voltage relationships of the wild type (n = 6), atalmt12-1 (n = 6) and cpk6-1 (n = 3). (C–E) Whole-cell S-type anion currents with 10 μM (C, D) or 50 μM (E) ABA in the bath solution. (C) Representative traces of S-type anion currents. (D) Current–voltage relationships of the wild type (n = 5) and atalmt12-1 (n = 7). (E) Current–voltage relationship of the wild type and atalmt12-1 (n = 2). (F) Representative traces of R-type anion currents in the wild-type and atalmt12-1. (G) Average peak R-type anion channel current in the wild type (n = 4) and atalmt12-1 (n = 3). All data are the mean ± SEM. Significant differences (Student’s t-test) were not observed between the wild type and atalmt12-1 in both the S-type anion current (E; P = 0.587 at −115 mV) and the R-type anion current (F; P = 0.348 at negative peak values).
Permanent Image Page
Printer Friendly View
XB-IMG-124778