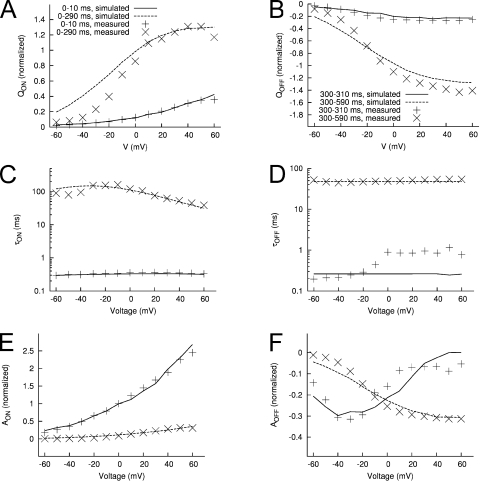
Figure 14. Features of measured and modeled Ig. Q-Vt relationships for IgON (A) and IgOFF (B). Time constants–Vt relationships for IgON (C) and IgOFF (D). Relationship of exponential fit coefficients to Vt for IgON (E) and IgOFF (F).
Image published in: Abbruzzese J et al. (2010)
© 2010 Abbruzzese et al. Creative Commons Attribution-NonCommercial-ShareAlike license
Permanent Image Page
Printer Friendly View
XB-IMG-125140