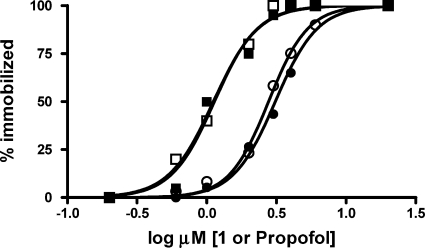
Figure 4. In vivo dose/response relationships. Tadpoles were evaluated with two end points: spontaneous (left set of curves, squares) and elicited (right set of curves, circles) movement. Filled symbols represent 1, and open symbols are propofol data. No significant differences between the two drugs could be detected for either end point.
Image published in: Hall MA et al. (2010)
Image downloaded from an Open Access article in PubMed Central. Copyright © 2010 American Chemical Society
Permanent Image Page
Printer Friendly View
XB-IMG-125159