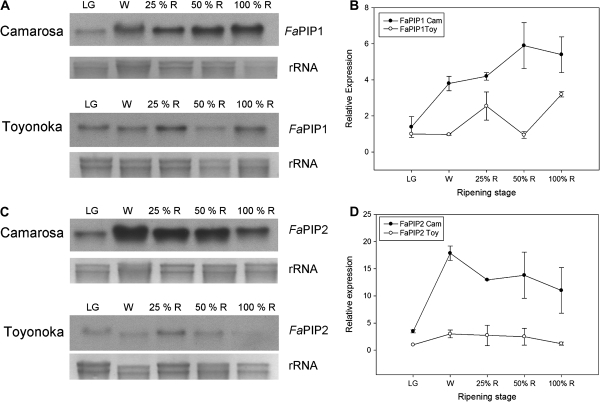
Fig. 6. FaPIP1 and FaPIP2 expression pattern during strawberry fruit ripening. (A, C). Northern blot showing the accumulation of FaPIP mRNA in different ripening stages of strawberry fruits: large green (LG), white (W), 25% red (25%R), 50% red (50%R), and 100% red (100%R) for two different cultivars, a firm (Camarosa) and a softer one (Toyonoka). (B, D) Quantification of FaPIP1 and FaPIP2 expression relative to Toyonoka LG stage is shown for Camarosa and Toyonoka cultivars (Gel Pro Analizer v 3.0 was used). Data are shown as mean ±SEM, n=2.
Image published in: Alleva K et al. (2010)
© 2010 The Author(s). Creative Commons Attribution-NonCommercial license
Permanent Image Page
Printer Friendly View
XB-IMG-125254