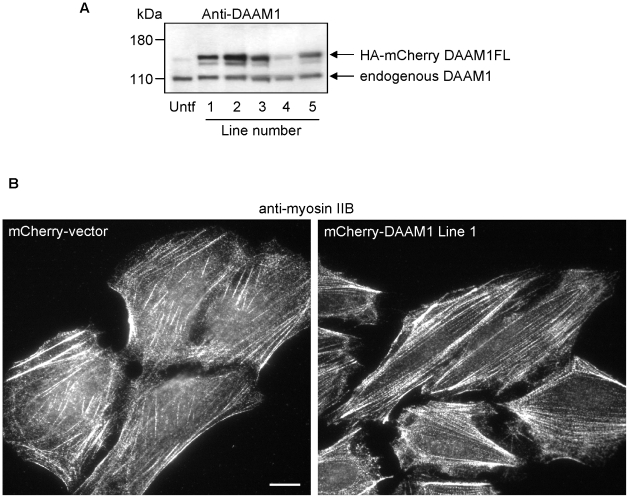
Figure 5. Stable expression of DAAM1 in U2OS cells.(A) Levels of mCherry-DAAM1 and endogenous DAAM1 in the five stable U2OS lines as determined by western analysis with anti-DAAM1. (B) Typical myosin IIB staining of the ventral membrane region for the control and mCherry-DAAM1 expressing cells. Bars = 10 µm.
Image published in: Ang SF et al. (2010)
Ang et al. Creative Commons Attribution license
Permanent Image Page
Printer Friendly View
XB-IMG-125330