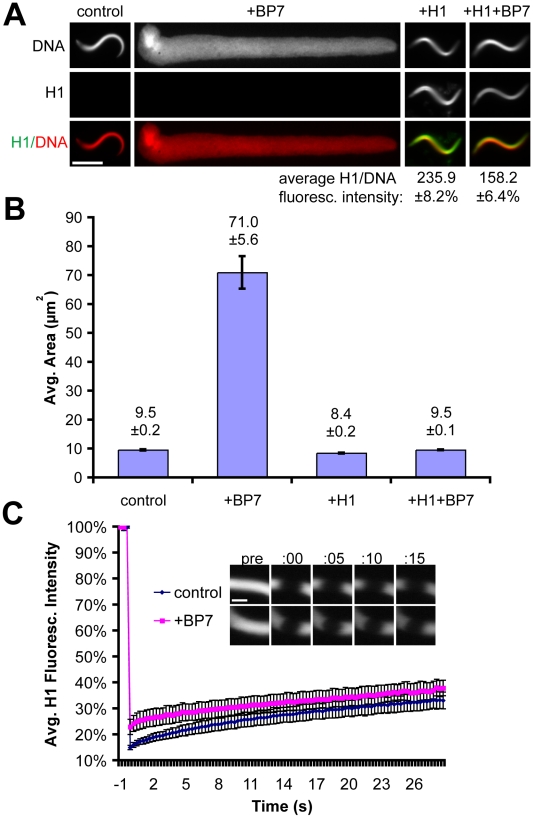
Figure 1. H1 and RanBP7 Have Opposing Activities in Buffer.(A) Fluorescence images of sperm nuclei in buffer with or without 4 µM RanBP7 and 1 µM H1A-GFP. Average H1:DNA fluorescence intensity is shown below for conditions supplemented with H1. Scale bar, 10 µm. (B) Average nuclear area of sperm in buffer (n>50) for conditions described in (A). (C) Averaged FRAP curves (n = 5) and corresponding timelapse images of H1A-GFP on sperm chromatin in buffer with or without RanBP7. The photobleach is plotted at time = 0. Scale bar, 2 µm. All quantification is shown ± standard error.
Image published in: Freedman BS et al. (2010)
Freedman et al. Creative Commons Attribution license
Permanent Image Page
Printer Friendly View
XB-IMG-125333