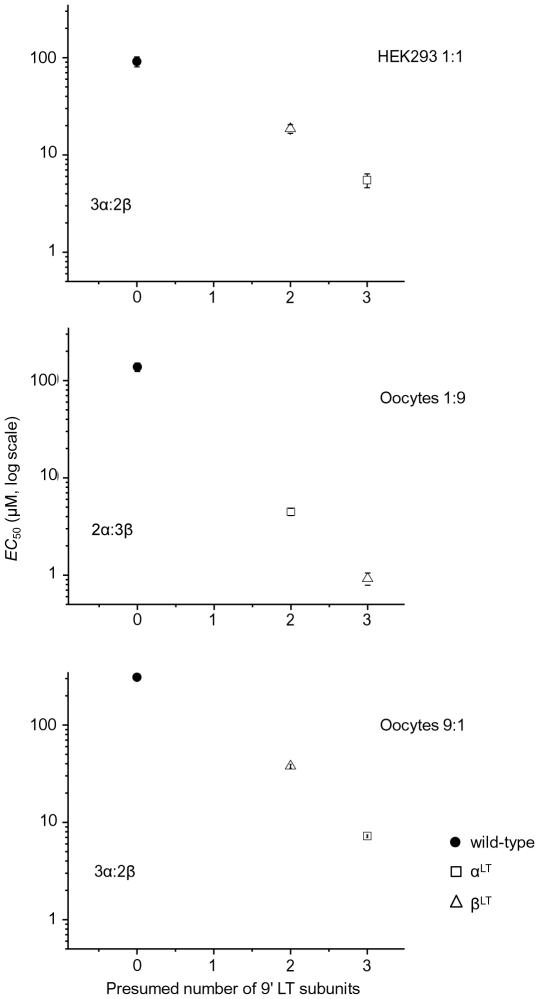
Figure 3. Relationship between the average EC50 values and the presumed number of 9′ LT mutations.Each point is plotted according to the stoichiometry we suggest for each cell type and subunit ratio. The assumed stoichiometry is stated on the plot. The linear relationship between the EC50 values and the number of mutated subunits confirms that the stoichiometry we assume is plausible.
Image published in: Krashia P et al. (2010)
Krashia et al. Creative Commons Attribution license
Permanent Image Page
Printer Friendly View
XB-IMG-125397