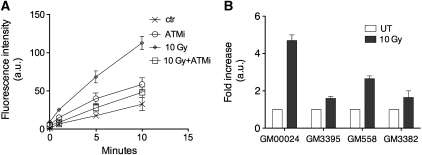
Figure 3. G6PD activity in human cells. (A) AG02603 cells were treated with or without 10 μM ATMi or 5 mM caffeine before being exposed to 10 Gy of IR. Cells were then lysed and G6PD activity was determined over the time as indicated. (B) Normal fibroblasts (GM0024B), A-T fibroblasts (GM03395), normal lymphoblasts (GM0558) and A-T lymphoblasts (GM03382) were irradiated with 10 Gy or left untreated. These cells were then lysed and G6PD activity was determined on whole cell extracts. The histogram represents the average fold increase of G6PD activity over non-treated corresponding cells. Error bars indicate s.d.
Image published in: Cosentino C et al. (2011)
Copyright © 2011, European Molecular Biology Organization. Creative Commons Attribution-NonCommercial-ShareAlike license
Permanent Image Page
Printer Friendly View
XB-IMG-125729