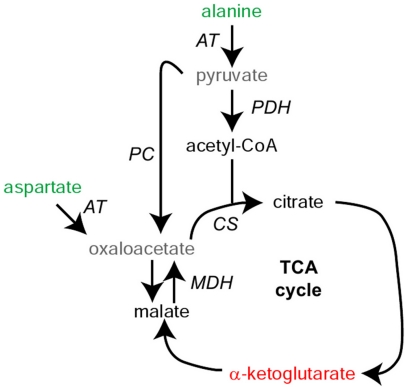
Figure 2. Metabolic fluxes that were traced in early embryos.Metabolites whose abundance increases in early development are shown in red, those whose abundance decreases are in green, those with no observable change are in black, and metabolites that were not measured are in grey. Enzymes are in italics. AT: aminotransferase, PDH: pyruvate dehydrogenase, PC: pyruvate carboxylase, CS: citrate synthase, MDH: malate dehydrogenase.
Image published in: Vastag L et al. (2011)
Vastag et al. Creative Commons Attribution license
Permanent Image Page
Printer Friendly View
XB-IMG-125741