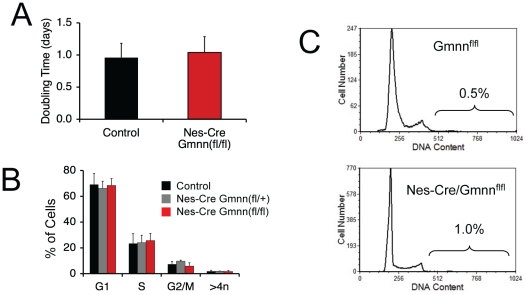
Figure 5. Nes-Cre/Gmnnfl/fl Neurosphere Cells Show Normal DNA Replication and Normal Cell Cycle Kinetics.(A)Doubling time, (B) cell cycle phase distribution, and (C) DNA content of neurosphere cells derived from Nes-Cre/Gmnnfl/fl mice and control littermates.
Image published in: Schultz KM et al. (2011)
Schultz et al. Creative Commons Attribution license
Permanent Image Page
Printer Friendly View
XB-IMG-125829