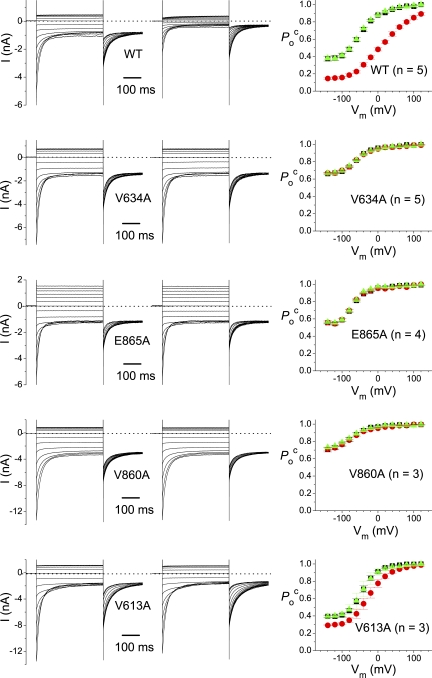
Figure 2. Effects of alanine mutations for four residues on the ATP modulation of CLC-1. (left and middle) Recording traces of WT CLC-1 and the four mutants. The recordings in the absence (left) and in the presence (middle) of 3 mM ATP were obtained from the same patch (pHi 6.8). (right) Steady-state Poc-V curves of WT CLC-1 and the four alanine mutants shown in left and middle panels. Black squares, red circles, and green triangles represent the data in control (before ATP), 3 mM ATP, and washout, respectively.
Image published in: Tseng PY et al. (2011)
© 2011 Tseng et al. Creative Commons Attribution-NonCommercial-ShareAlike license
Permanent Image Page
Printer Friendly View
XB-IMG-125865