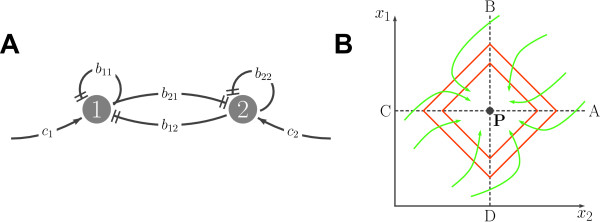
Figure 2. The sRNA network. A. The graph associated with the sRNA network B. Sectors, Lyapunov function level curves (orange) and qualitative behavior of the trajectories (green) for the sRNA system
Image published in: Blanchini F and Franco E (2011)
Copyright ©2011 Blanchini and Franco; licensee BioMed Central Ltd. Creative Commons Attribution license
Permanent Image Page
Printer Friendly View
XB-IMG-126163