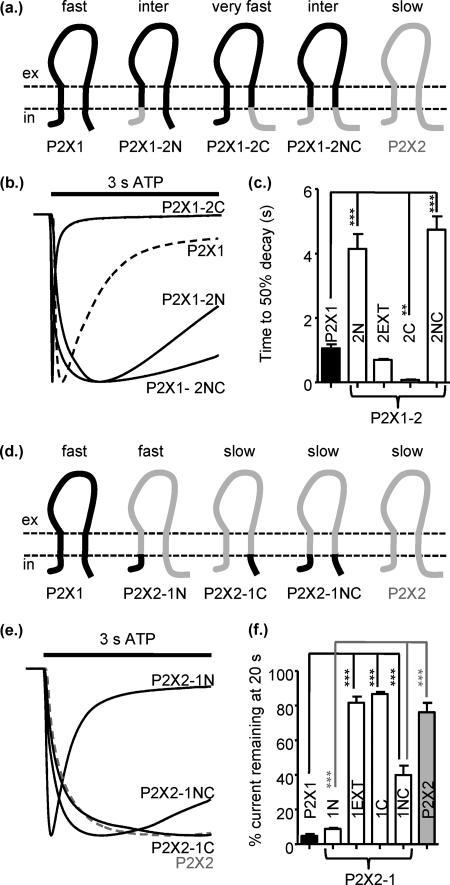
FIGURE 4. Contribution of the intracellular regions to regulation of P2X receptor time-course. a, shown is a schematic representation of P2X receptors and chimeras. inter, intermediate. b, representative currents were mediated by application of 100 μm ATP to chimeric receptors expressed in Xenopus oocytes. c, a histogram summary shows the time to 50% current decay during the continued presence of ATP. d, shown is a schematic representation of P2X receptors and chimeras. e, representative currents were mediated by application of 100 μm ATP to chimeric receptors expressed in Xenopus oocytes. c, a histogram summary shows the percentage of current remaining at the end of a 20-s 100 μm ATP application. **, p < 0.01; ***, p < 0.001 (n = 5–17).
Image published in: Allsopp RC and Evans RJ (2011)
© 2011 by The American Society for Biochemistry and Molecular Biology, Inc. Creative Commons Attribution-NonCommercial license
Permanent Image Page
Printer Friendly View
XB-IMG-126728