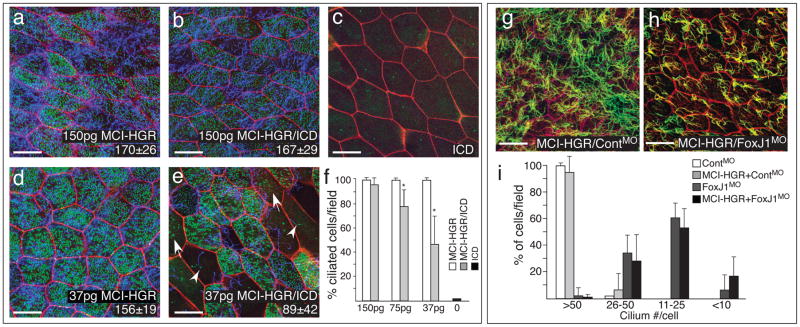
Figure 3. MCI acts downstream of Notch to promote centriole assembly and motile cilia extension via FoxJ1(a–e) Shown are confocal images of the skin in embryos injected with varying amounts of MCI-HGR RNA (a,d), ICD RNA (c), or both RNAs (b,e), along with mRFP (red) and Centrin4-GFP RNA (green) as a tracer and to mark centrioles, respectively. Embryos were treated with DEX at stage 11.5, fixed at stage 28 and stained with acetylated tubulin to visualize cilia (blue). In embryos injected with ICD and 37pgs of MCI-HGR RNA (e), MCC differentiation was sometimes incomplete, resulting in cells extending cilia but failing to undergo centriole assembly (arrowhead) or vice versa (arrow). Average number of centrioles (lower right, ±s.d.) is statistically the same with or without ICD at 150pg of MCI-HGR but different at 37pg of MCI-HGR RNA (p=6×10⁻⁶). Scale bars=20 microns. (f) The average percentage of MCCs (multiple centrioles and cilia) per field (±s.d) is plotted based on data obtained from three fields from four embryos (n=12). Values marked with an asterisk are highly significant (p<.005). (g–h) Shown are confocal images of the skin of embryos injected with MCI-HGR RNA, Centrin4-RFP and mRFP RNA, followed by a FoxJ1 (h) or a control morpholino (g)7. Embryos were treated with DEX at stage 11.5, fixed at stage 28 and stained with an acetylated tubulin antibody to label cilia (green). Scale bars=20microns. (i) Cilia number per cell was scored from two fields from five embryos (n=10) for each condition, and plotted as the average fraction of cells (±s.d.) with different cilia number as indicated per field.
Image published in: Stubbs JL et al. (2012)
Image downloaded from an Open Access article in PubMed Central. Image reproduced on Xenbase with permission of the publisher and the copyright holder.
Permanent Image Page
Printer Friendly View
XB-IMG-127086