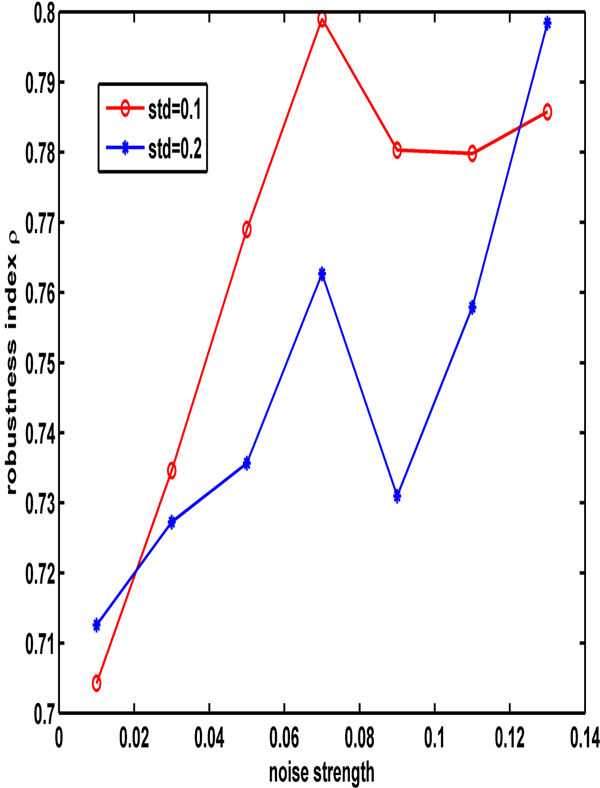
Figure 9. The effects of the signal strength on the robustness in noise signal input under the variation of parameters at 10% and 20%. The legend with circle and star lines represent the variation of 10% and 20%, respectively.
Image published in: Zhang W and Zou X (2012)
Copyright ©2012 Zhang and Zou; licensee BioMed Central Ltd. Creative Commons Attribution license
Permanent Image Page
Printer Friendly View
XB-IMG-127356