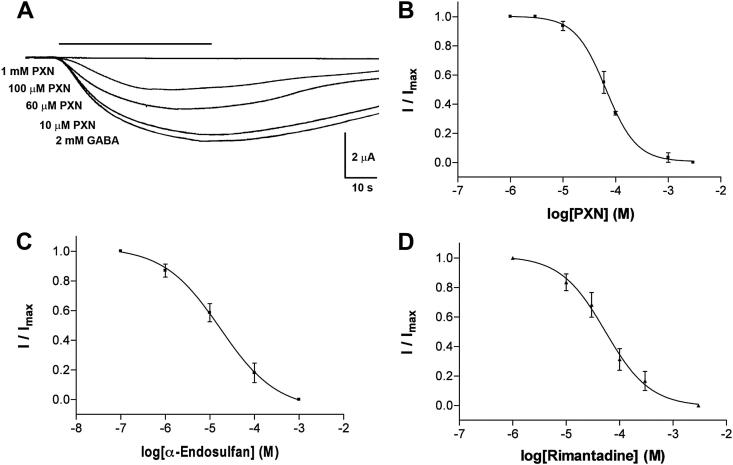
Fig. 3. ELIC antagonists. (A) Example traces showing inhibition by picrotoxinin (PXN). Concentration–inhibition curves for PXN (B), α-endosulfan (C), and rimantadine (D). Inhibition was measured at the GABA EC50 (1.6 mM). Data = mean ± SEM, n ≥ 4. Values derived from the curves can be found in Table 2.
Image published in: Thompson AJ et al. (2012)
© 2012 Elsevier Ltd. Creative Commons Attribution license
Permanent Image Page
Printer Friendly View
XB-IMG-127467