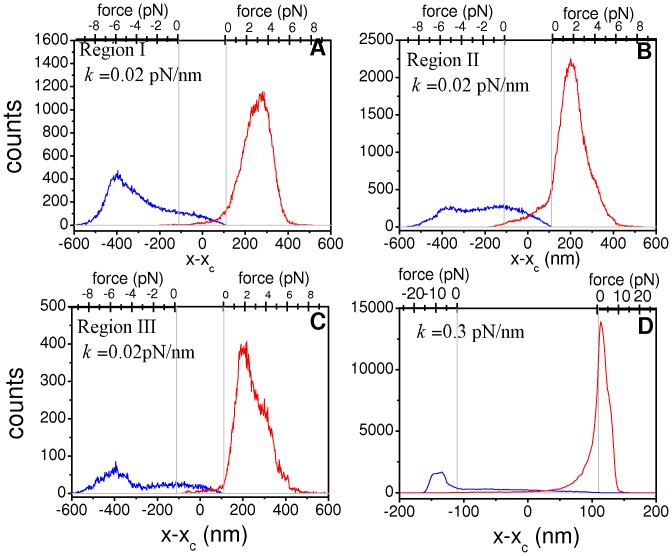
Figure 5. Spatial distributions of motors around cargo position for different intervals of the cargo velocity.In all panels, the red and blue curves indicate the distribution of forward and backward motors, respectively. The force scales at the top axis indicate the force exerted by a motor located at the corresponding position. The vertical gray lines indicate the limit positions x−xc = ±110 nm separating regions of pulling and non-pulling motors. Panels (A), (B) and (C) show the results for the RS (k = 0.02 pN/nm) considering the velocity regions I, II and III defined in the main text, respectively. Panel (D) shows the results for the system with k = 0.3 pN/nm studied in Figure 3G considering the region 300 nm/s
Image published in: Bouzat S et al. (2012)
Image reproduced on Xenbase with permission of the publisher and the copyright holder. Creative Commons Attribution license
Permanent Image Page
Printer Friendly View
XB-IMG-127480