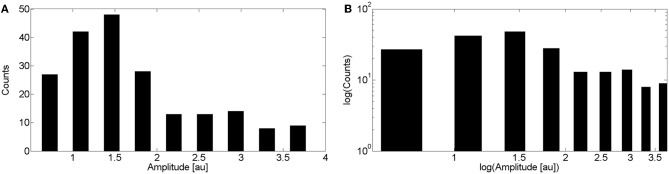
Figure 5. Distribution of puff amplitudes obtained experimentally. (A) Distribution obtained by pooling together data from 202 puffs observed in 13 cells. Experiments were performed as explained in the “Materials and Methods” sections. (B) Same as (A) but on a logarithmic scale.
Image published in: Lopez L et al. (2012)
Copyright © 2012 Lopez, Piegari, Sigaut and Ponce Dawson. Creative Commons Attribution license
Permanent Image Page
Printer Friendly View
XB-IMG-127508