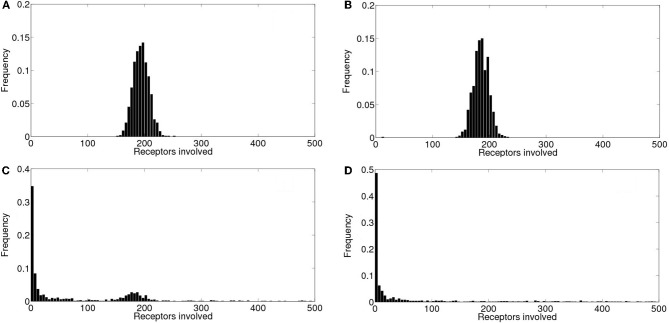
Figure 9. Event size distributions obtained for different values of the cytosolic Ca2+ clearing rate. Distribution of the number of IP3R's that participate of the signals when all the parameters are kept at the values used in section 5 except for the cytosolic Ca2+ clearing rate for which we used: (A) δCa = 20/s, (B) δCa = 25/s, (C) δCa = 30/s, (D) δCa = 200/s.
Image published in: Lopez L et al. (2012)
Copyright © 2012 Lopez, Piegari, Sigaut and Ponce Dawson. Creative Commons Attribution license
Permanent Image Page
Printer Friendly View
XB-IMG-127512