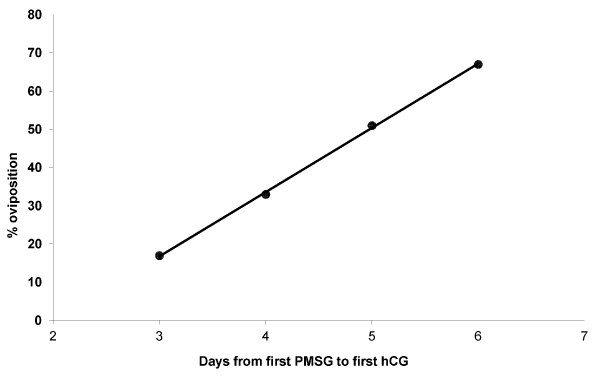
Figure 1. Regression of mean% femaleM. fasciolatusovipositing against time from first PMG injection to first hCG injection. Data from Treatment Group “PMSG and hCG” in Table 3 (R2 = 0.9994; p<0.001).
Image published in: Clulow J et al. (2012)
Copyright ©2012 Clulow et al. Creative Commons Attribution license
Permanent Image Page
Printer Friendly View
XB-IMG-127842