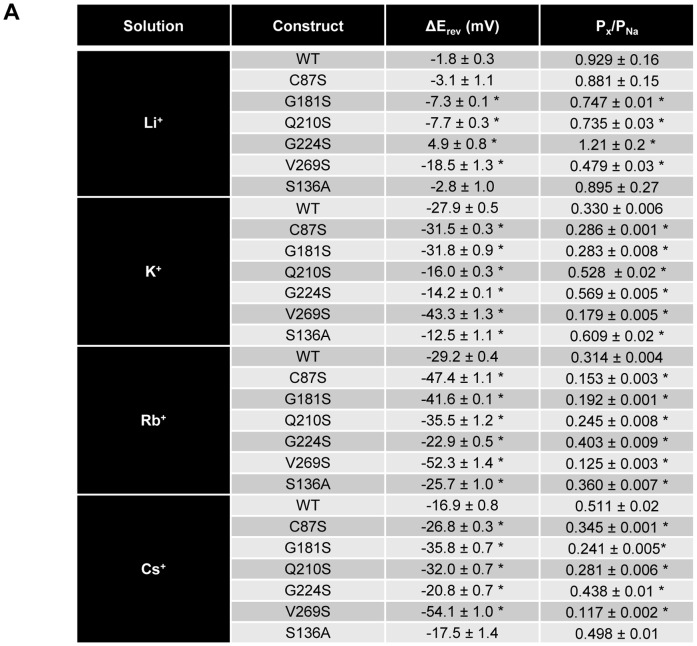
Figure 3. Shifts in reversal potential and permeability ratio comparison of single serine ChR2 constructs.Changes in reversal potential were calculated by subtracting Erev in cation X+ from Erev in Na+ (mean±S.E.M; n = 7–25). Permeability ratios were calculated using changes in reversal potential. Values are reported as mean±S.E.M (n = 7–25). For significance testing, mutant ChR2 values were compared to WT in the same solution. Statistically significant values are denoted by a *(P<0.001).
Image published in: Richards R and Dempski RE (2012)
Image reproduced on Xenbase with permission of the publisher and the copyright holder. Creative Commons Attribution license
Permanent Image Page
Printer Friendly View
XB-IMG-127876