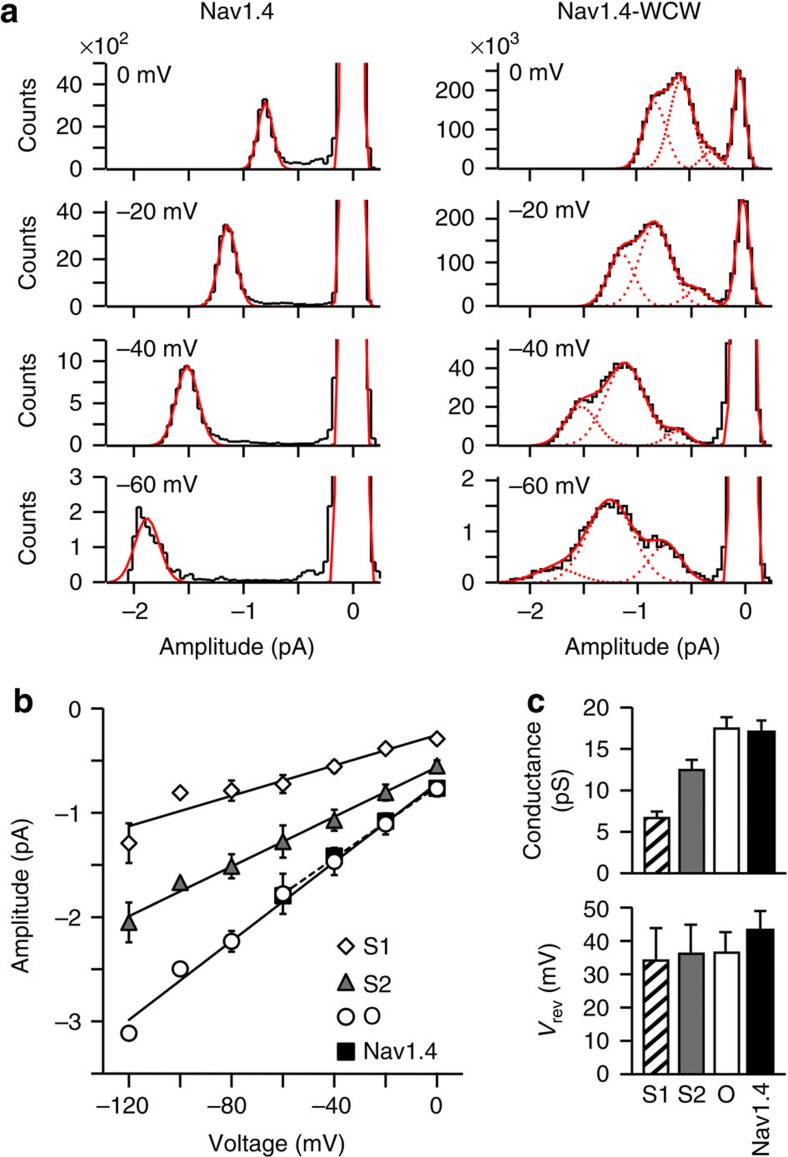
Figure 3. Voltage dependence of individual conductance levels.(a) Single channel amplitude distributions for Nav1.4 (left) and Nav1.4-WCW (right). Histograms were obtained from all points in a single channel patch after discarding points adjacent to changes in amplitude in the idealized record to remove artifacts due to filtering. Red dashed lines are individual Gaussian fits to each conductance level, and the solid red line is their sum. (b) Current–voltage (I–V) relation for each conductance level (mean±s.e.m.) and its linear fit. The main conductance level for Nav1.4 (squares) nearly overlaps that of Nav1.4-WCW (circles). Data between −120 and −80 mV are from deactivation to the indicated potential (Supplementary Fig. S3). (c) Summary of the conductance (top) and reversal potential (Vrev, bottom) for each conductance level from linear fits to the I–V for individual patches. Conductances were (mean±s.e.m.), for Nav1.4-WCW: S1=6.8±0.9 pS, S2=12.5±1.3 pS, O=17.5±1.4 pS; and for Nav1.4: 17.1±1.4 pS. Extrapolated reversal potentials were (mean±s.e.m.), for Nav1.4-WCW: S1=34.2±9.9 mV, S2=36.3±8.9 mV, O=36.6±6.3 mV; and for Nav1.4: 43.4±5.8 mV.
Image published in: Goldschen-Ohm MP et al. (2013)
Copyright © 2013, Nature Publishing Group, a division of Macmillan Publishers Limited. Creative Commons Attribution-NonCommercial-ShareAlike license
Permanent Image Page
Printer Friendly View
XB-IMG-128283