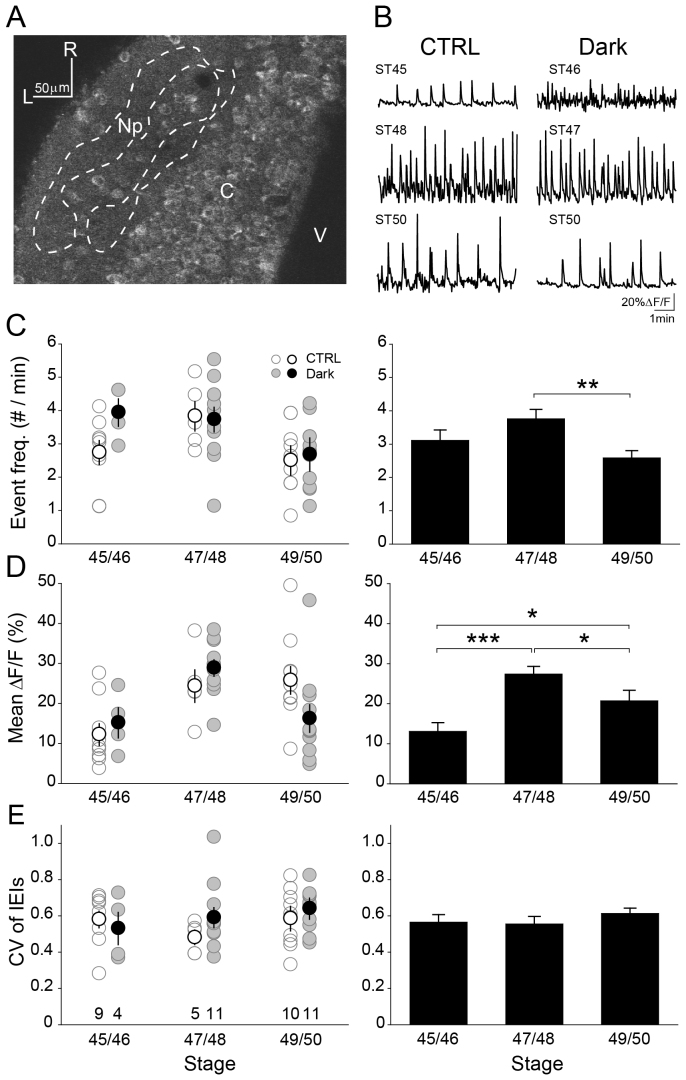
Figure 1. Development of spontaneous Ca2+ events in Xenopus tectum depends on stage but not visual-experience.(A) Movie frame of optic tectum stained by OGB-1AM. Spontaneous Ca2+ events were assessed in the neuropil (Np; surrounded by a dashed line). C: cell body layer, V: ventricular layer, R: rostral, L: lateral. (B) Example traces of spontaneous Ca2+ events in tecta reared under a control 12/12 hours light/dark cycle (CTRL: left column) and a dark condition (Dark: right column) at different developmental stages. (C–D) Analysis of event frequency and magnitude of spontaneous activity. Within-stage comparisons between the two rearing conditions were performed by unpaired t-test (left column). Between-stage comparisons after pooling the two rearing conditions were performed by Fisher's protected least significant difference test (right column). (C) Mean ± S.D. of event frequency in each groups is; 2.7 ± 1.0 (CTRL) vs. 3.9 ± 0.8 (Dark) at stage 45/46, 3.8 ± 1.0 vs. 3.7 ± 1.2 at stage 47/48, and 2.5 ± 1.0 vs. 2.7 ± 1.0 at stage 49/50. (D) Mean ± S.D. of event magnitude in each group is; 12.2 ± 8.1 (CTRL) vs. 15.1 ± 7.6 (Dark) at stage 45/46, 24.3 ± 9.1 vs. 28.9 ± 6.8 at stage 47/48, and 25.8 ± 10.8 vs. 16.2 ± 11.4 at stage 49/50. (E) Coefficient of variation (CV) of inter-event intervals (IEIs) of spontaneous activity. Mean ± S.D. of CV of IEI in each group is; 0.56 ± 0.14 (CTRL) vs. 0.53 ± 0.18 at stage 45/46, 0.48 ± 0.08 vs. 0.59 ± 0.18 at stage 47/48, and 0.59 ± 0.15 vs. 0.64 ± 0.12 at stage 49/50. Sample size at each stage in the two different rearing conditions is noted in (E). *: p<0.05, **: p<0.01, ***: p<0.001. Error bars are S.E.M.
Image published in: Imaizumi K et al. (2013)
Copyright © 2013, Macmillan Publishers Limited. Creative Commons Attribution-NonCommercial-ShareAlike license
Permanent Image Page
Printer Friendly View
XB-IMG-128514