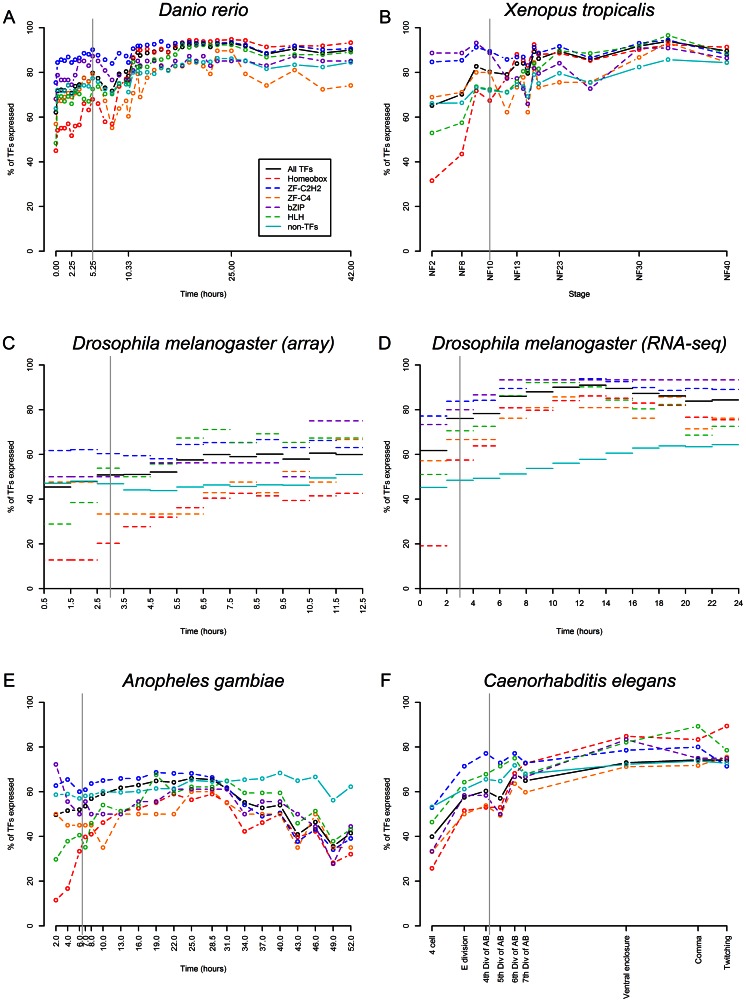
Figure 2. TF and TF family expression throughout embryogenesis based on microarray or RNA-seq data.The gray vertical line in each plot indicates the onset of gastrulation. Table S2 shows the numbers of TFs and members of TF families included in each dataset used for this figure.
Image published in: Schep AN and Adryan B (2013)
Image reproduced on Xenbase with permission of the publisher and the copyright holder. Creative Commons Attribution license
Permanent Image Page
Printer Friendly View
XB-IMG-128813