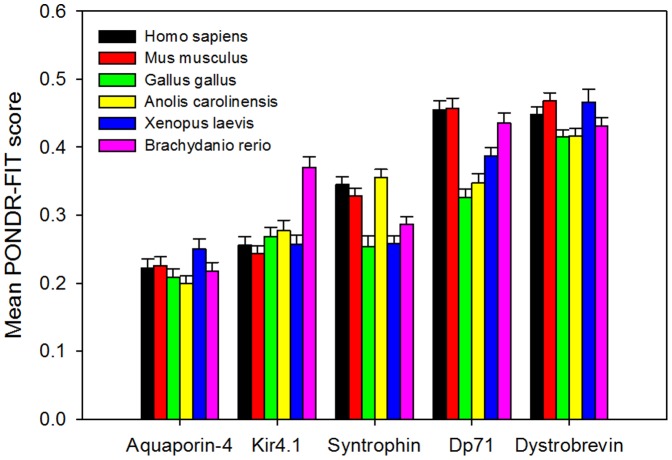
Figure 3. Mean disorder scores evaluated for five DAPC proteins from six vertebrate species: Homo sapiens (black bars), Mus musculus (red bars), Gallus gallus (green bars), Anolis carolinensis (yellow bars), Xenopus laevis (blue bars), and Brachydanio rerio (pink bars).Error bars represent the corresponding standard errors.
Image published in: Na I et al. (2013)
Image reproduced on Xenbase with permission of the publisher and the copyright holder. Creative Commons Attribution license
Permanent Image Page
Printer Friendly View
XB-IMG-129075