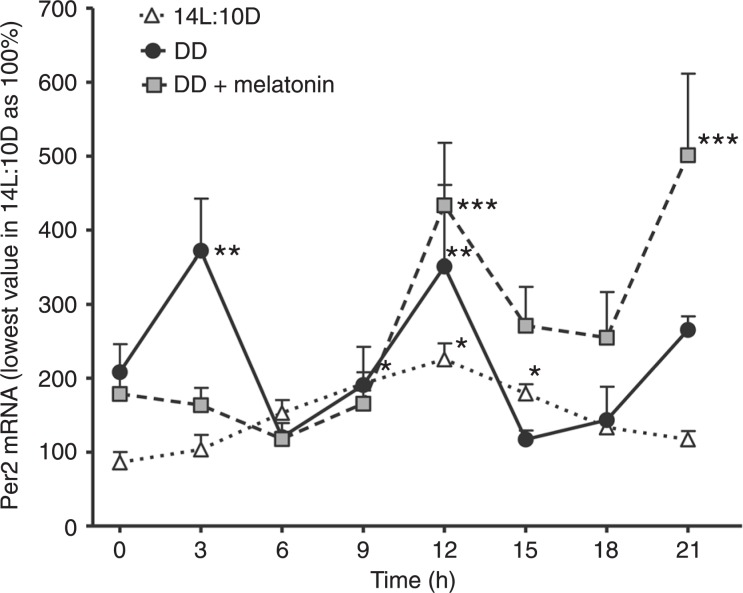
Figure 5. Relative Per2 expression under a 14-h light:10-h dark (14L:10D) regime, constant darkness (DD) or DD plus 1.0 nM melatonin. Each point is the mean ± SEM for 6-10 cultures. *, ** and ***P < 0.05 for time course differences in 14L:10D, DD and DD + melatonin, respectively (ANOVA followed by the Tukey test).
Image published in: Bluhm AP et al. (2012)
Image reproduced on Xenbase with permission of the publisher and the copyright holder. Creative Commons Attribution-NonCommercial license
Permanent Image Page
Printer Friendly View
XB-IMG-129414