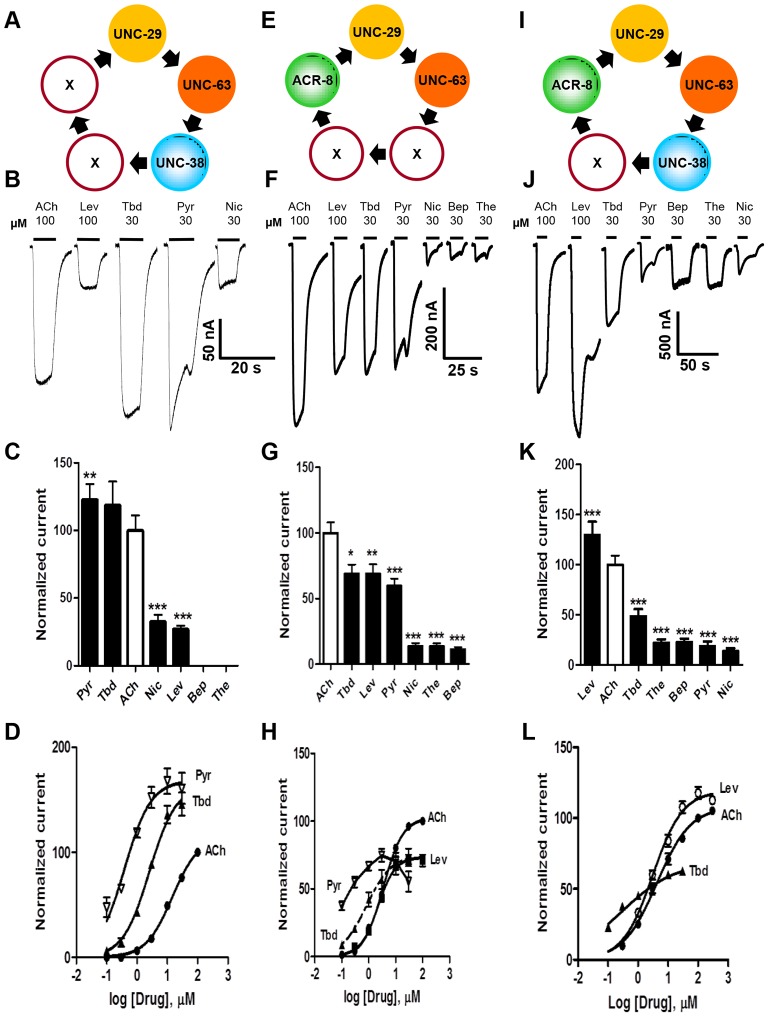
Figure 3. Voltage-clamp of oocytes injected with different combinations of the four O. dentatum nAChR subunits.(A) Depiction of a possible arrangement of O. dentatum UNC-29, UNC-63 & UNC-38. âXâ represents any of the subunits. PyR, pyrantel; Tbd, tribendimidine, ACh, acetylcholine; Nic, nicotine; Bep, bephenium; The, thenium. (B) Representative traces of inward currents elicited by the various agonists in oocytes injected with 1â¶1â¶1 Ode-unc-29â¶Ode-unc-63â¶Ode-unc-38. Pyr & Tbd were the most potent agonists on this receptor subtype. (C) Bar chart (mean ± se) of currents elicited by the different agonists in the Ode-(29 - 38 - 63) Pyr/Tbd-nAChR (paired t-test, **p<0.01, ***p<0.001). (D) Dose-response of normalized currents vs log concentration for Pyr (inverted Î, nâ=â6), Tbd (â´, nâ=â6) and ACh (â¢, nâ=â5) in the Pyr/Tbd-nAChR. (E) Diagrammatic representation of the three subunits, unc-29, unc-63 and acr-8 injected into oocytes. âXâ could be any of the three subunits. (F) Representative traces of inward currents produced by the different agonists in oocytes injected with 1â¶1â¶1 Ode-unc-29â¶Ode-unc-63â¶Ode-acr-8. (G) Bar chart (mean ± se) of normalized currents elicited by the different agonists in the Ode(29-63-8) receptor subtype. All currents normalized to 100 µM ACh currents; comparisons made with the ACh currents (paired t-test, *p<0.05, **p<0.01, ***p<0.001). (H) Dose-response plot of normalized currents vs log. Concentration of Pyr (inverted Î, nâ=â6), Tbd (â´, nâ=â6), ACh (â¢, nâ=â6) and Lev (âª, nâ=â6). (I) Representation of a possible arrangement of the four O. dentatum subunits injected into Xenopus oocytes. (J) Representative traces of inward currents elicited by the different agonists on the Ode(29â63â38â8) or Lev-nAChR. (K) Bar chart (mean ± se) of normalized currents elicited by the different agonists on the Lev-nAChR subtype. Comparisons were made with 100 µM ACh currents, which was used for the normalization (paired t-test, ***p<0.001). (L) Dose-response plot of normalized currents against log of Tbd (â´, nâ=â6), ACh (â¢, nâ=â18) and Lev (â, nâ=â5) concentrations.
Image published in: Buxton SK et al. (2014)
Image reproduced on Xenbase with permission of the publisher and the copyright holder. Creative Commons Attribution license
Permanent Image Page
Printer Friendly View
XB-IMG-129580