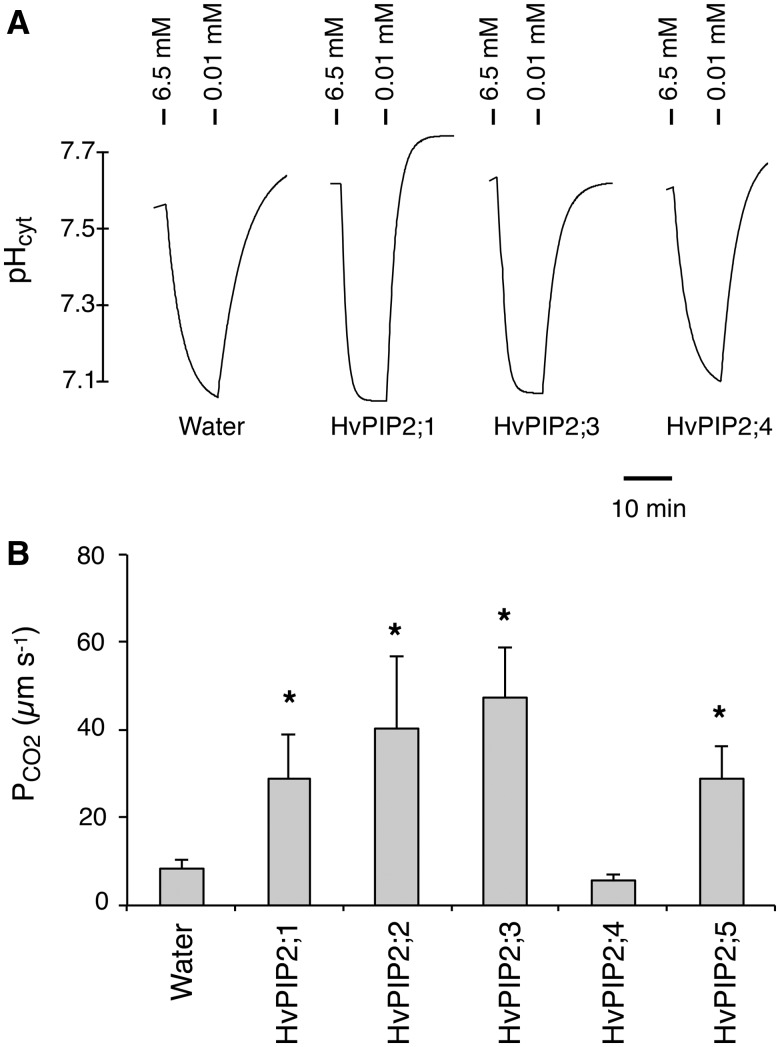
Fig. 2. CO2 permeability of PIP2 aquaporins of barley. (A) Representative traces of cytosolic pH change of water-, HvPIP2;1 cRNA-, HvPIP2;3 cRNA- and HvPIP2;4 cRNA-injected X. laevis oocytes. cRNAs and carbonic anhydrase were injected 24–48 h before the measurements. Ticks above the traces indicate where the bath solutions were replaced with the modified Barth’s solution containing the designated concentrations of CO2/H2CO3. (B) PCO2 of the cell membrane of X. laevis oocytes injected with water (n = 14), HvPIP2;1 cRNA (n = 10), HvPIP2;2 cRNA (n = 5), HvPIP2;3 cRNA (n = 6), HvPIP2;4 cRNA (n = 7) or HvPIP2;5 cRNA (n = 3). Error bars indicate the SEM. Asterisks indicate significant difference of the mean from the water-injected control (Water) by Student’s t-test at α = 0.05.
Permanent Image Page
Printer Friendly View
XB-IMG-129617