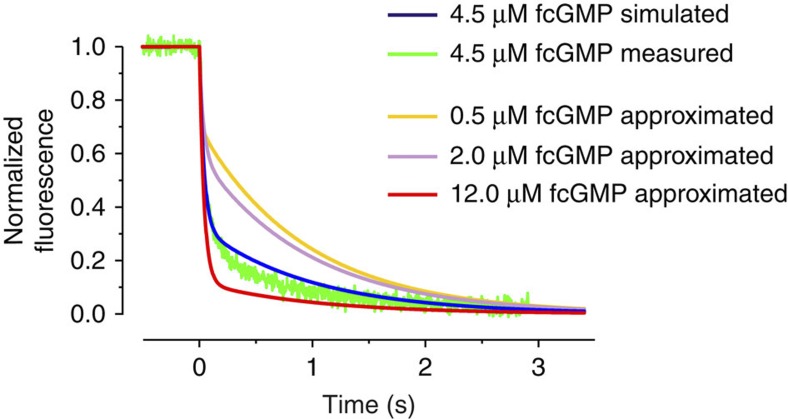
Figure 5. Predicted and measured time course of ligand unbinding at 4.5 μM fcGMP.The approximated time courses of ligand unbinding at 0.5 μM, 2.0 μM, 4.5 μM and 12 μM fcGMP are obtained by the global fit with the C4L-*O4L model (c.f. Fig. 3). The time course at 4.5 μM (blue curve), simulated with C4L-*O4L model, approximately matches the experimentally determined time course at this concentration (green trace). The experimentally determined time course is the average from five individual time courses.
Image published in: Nache V et al. (2013)
Copyright © 2013, Nature Publishing Group, a division of Macmillan Publishers Limited. Creative Commons Attribution-NonCommercial-NoDerivatives license
Permanent Image Page
Printer Friendly View
XB-IMG-136683