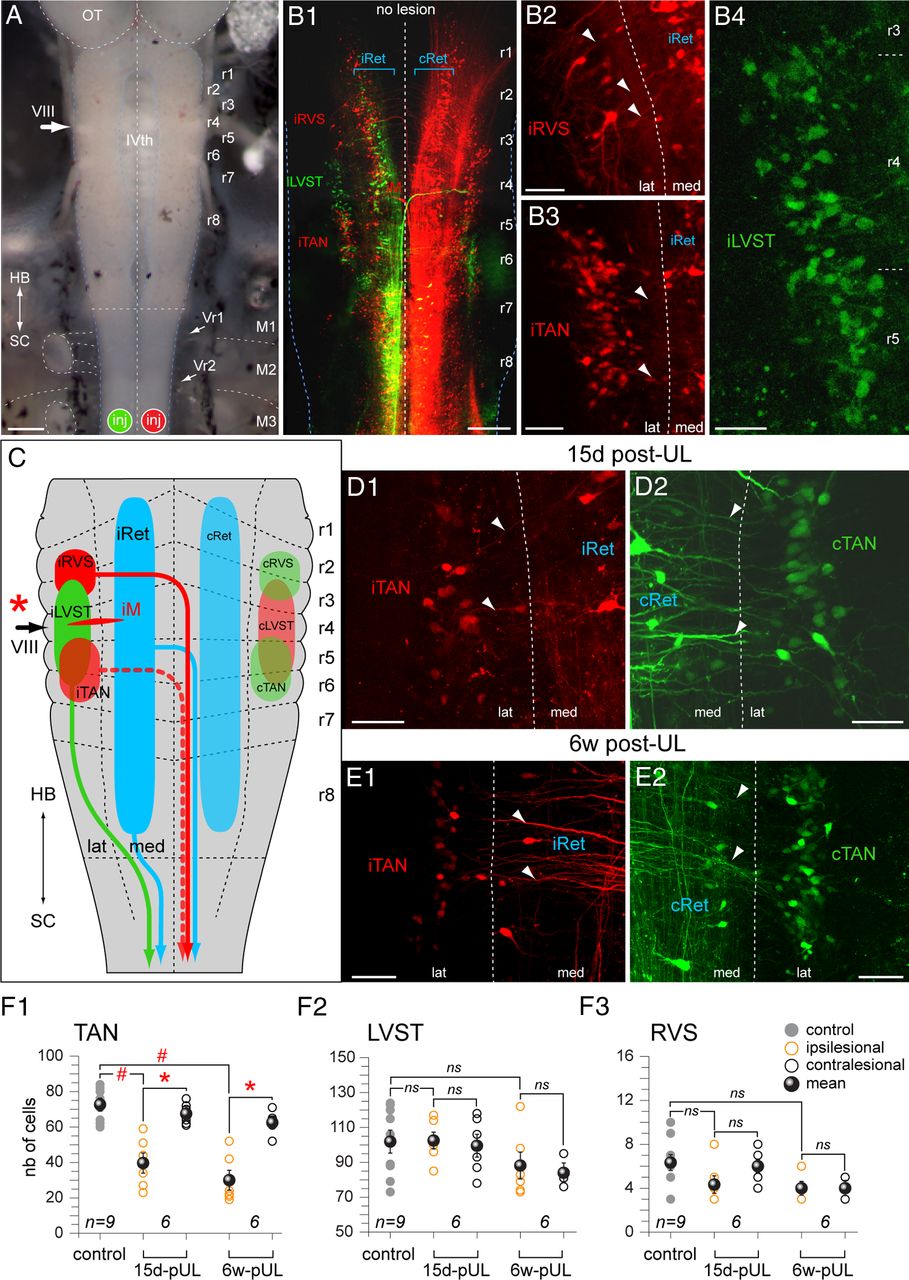
Figure 8. Loss of vestibulospinal neurons after UL in stage 55â57 Xenopus tadpoles. A, Photomicrograph of the hindbrain (HB) and rostral spinal cord (SC) depicting the sites of application of Alexa Fluor 488 dextran (inj, green) and of Alexa Fluor 546 dextran (inj, red) to the left and right upper spinal cord, respectively, in controls and 15 d and 6 weeks (6w) after UL on the left side. B, Confocal reconstruction of bilateral spinal-projecting neurons in the hindbrain of a control animal (B1, no lesion) illustrating the 3 major vestibulospinal cell groups with ipsilateral (i) or contralateral (c) axonal trajectories; higher magnification of retrogradely labeled neurons in the left vestibular nucleus that distinguish into a RVS (B2) and TAN (B3), both with crossed projections (labeled in red), respectively, and a third subgroup that gives rise to the uncrossed (labeled in green) lateral vestibulospinal tract (LVST, B4). C, Summary depicting the segmental organization along r1âr8 and axonal trajectories of the 3 major vestibulospinal subgroups, the Mauthner cell (M) and the bilateral, segmentally iterated reticulospinal neurons (iRet, cRet) on the ipsilesional side (red asterisk) and contralesional side. D, E, Confocal reconstructions of TAN neurons with midline-crossing descending axons on the ipsilesional side (iTAN; D1,E1) and contralesional side (cTAN; D2,E2) side 15 d (D) and 6 weeks (E, 6w) after UL; TAN neurons on the two sides of the brainstem were retrogradely labeled after unilateral application of two different tracers to the two sides of the upper spinal cord (A, inj). F, Numbers (mean ± SE) of retrogradely labeled neurons in the TAN (F1), LVST (F2), and RVS (F3) subgroups of controls and on the ispilesional and contralesional side of animals 15 d and 6 weeks (6w) postlesion; the number of labeled cells in the TAN (F1) but not the LVST (F2) or RVS (F3) on the ipsilesional side was significantly reduced with respect to the contralesional side 15 d and 6 weeks postlesion (*p ⤠0.05; Wilcoxon signed-rank test for paired parameters; n.s.); with respect to controls, only the number of labeled cells in the TAN (F1) but not the LVST (F2) or RVS (F3) on the ipsilesional side was significantly reduced (#p ⤠0.05; MannâWhitney U test for unpaired parameters; n.s.); n indicates the number of animals in each group; IVth, IVth ventricle; lat, lateral; med, medial; OT, optic tectum; M1â3, myotomes 1â3; Vr, SVr. Scale bars in A represent 300 μm; B1, 200 μm; B2âB4, D1, D2, E1, E2, 50 μm.
Image published in: Lambert FM et al. (2013)
Copyright © 2013. OA ARTICLE, images redisplayed under a Creative Commons license.
Permanent Image Page
Printer Friendly View
XB-IMG-138222