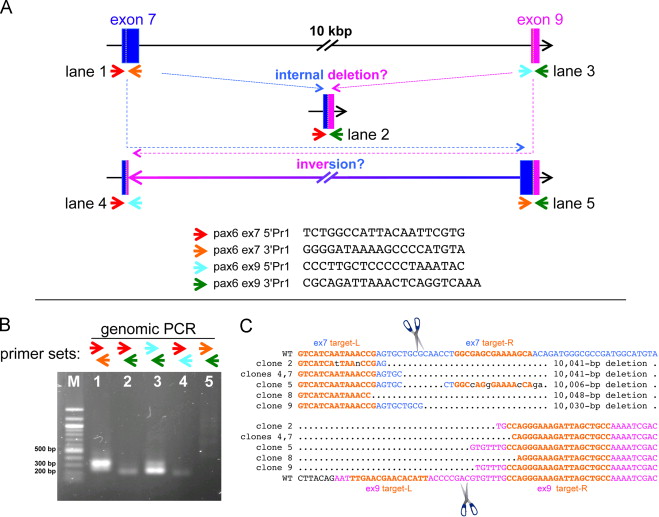
Fig. 3. Strategy for screening mutations in the pax6 locus edited by two pairs of TALENs targeting exon 7 and exon 9 simultaneously. (A) Schematic drawing of targeting regions, only showing exon 7 (blue) and exon 9 (magenta) for simplicity (not to scale). Small colored arrows indicate different primers for genomic PCR of exon 7 and exon 9 (each sequence is shown on the bottom, from 5â² to 3â²). Different combinations of primers can amplify other possible junction regions created by deletion or inversion between exons 7 and 9 as schematically shown. (B) A representative gel pattern of genomic-PCR bands from an embryo injected with both pairs of TALENs mRNAs. In this specific case, one of the possible junctions representing a 3â² inversion site (where a 3â² piece of exon 7 would have been fused inverted to 3â² piece of exon 9, lane 5) was not detected, but in other cases, we have seen such a band. (C) The genomic-PCR band corresponding to what is shown in lane 2 in (B) from 3 pooled embryos was gel-purified, cloned, and sequenced. The results of 6 clones are aligned. Only regions between two target sites (target-Ls, left target; target-Rs, right target in orange) are shown. Corresponding wild-type sequences are shown on top for exon 7 and on the bottom for exon 9. Multiple 10-kb deletion events were confirmed, and junctions where 5â² parts of exon 7 (blue) fused to 3â² parts of exon 9 (magenta) were seen in the expected cleavage regions (in between left and right targets, indicated by scissors) in both exons 7 and 9, suggesting that 10-kbp deletions were due to cleavages by TALENs and thus both TALENs were functional. (For interpretation of the references to color in this figure legend, the reader is referred to the web version of this article.)
Image published in: Nakayama T et al. (2015)
Copyright © 2015. Image reproduced with permission of the Publisher, Elsevier B. V.
Permanent Image Page
Printer Friendly View
XB-IMG-140011