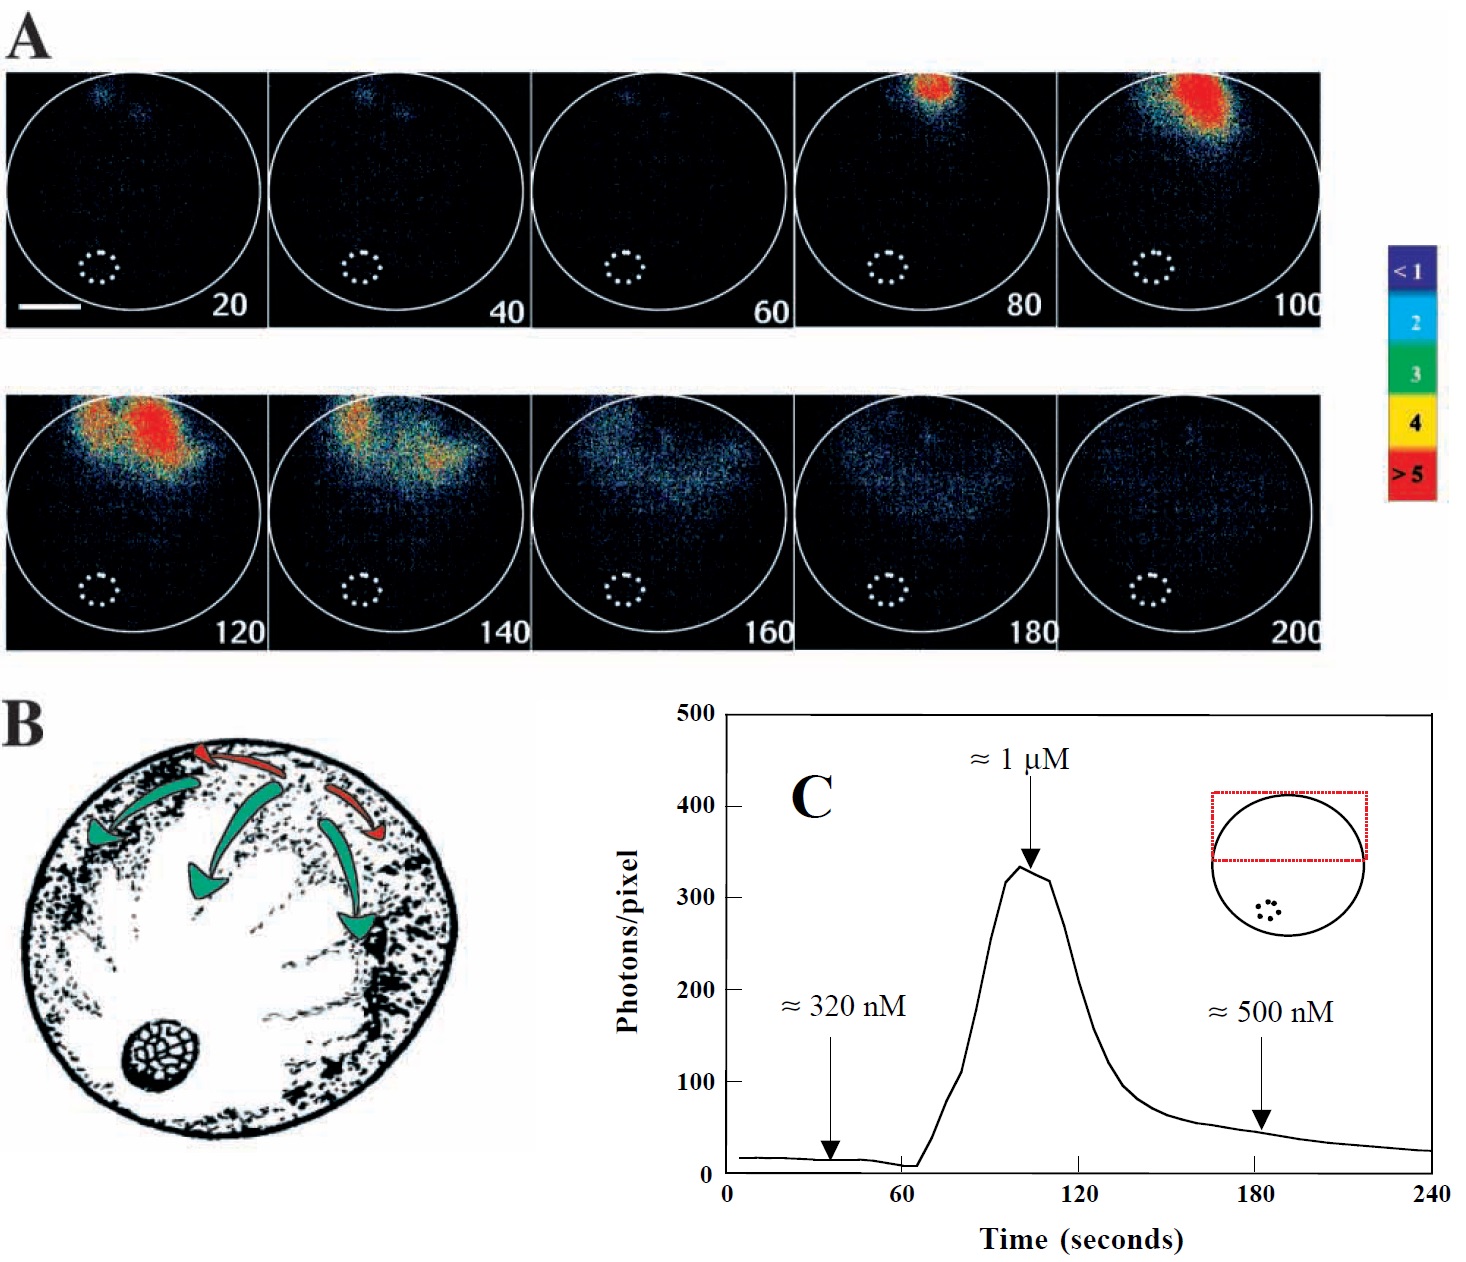
Fig. 6. A detailed view of a propagating Ca2+ transient that occurred in the dorsal ectoderm of a representative embryo at stage 11.5. (A) Sequence taken every 20 seconds to show the appearance and subsequent disappearance of a propagating Ca2+ wave. Each panel represents 120 seconds of accumulated light. Wave velocity, calculated from the spread of the wave over successive images, was estimated to be approximately 10 mm/second. (B) Diagram to illustrate the propagation pathway of the wave, both laterally (red arrows) and from the animal pole toward the vegetal pole (blue arrows) in a radial manner. (C) Temporal profile of the luminescence output generated by the wave shown in A. The inset shows the region of the embryo from which the light was collected. Note that after the transient the [Ca2+]i in participating cells did not return to its original resting level. Levels of calcium (arrows on C) are estimated from photon counting assuming (1) that the resting level of Ca2+ is 320 nM and (2) that [Ca2+]i varies as the square of the luminescence (Shimomura, 1995). The colour scale indicates luminescence flux in photons/pixel. Scale bar, 0.3 mm.
Image published in: Leclerc C et al. (2000)
Copyright © 2000. Image reproduced with permission of the Publisher, The Company of Biologists Ltd.
Permanent Image Page
Printer Friendly View
XB-IMG-146033