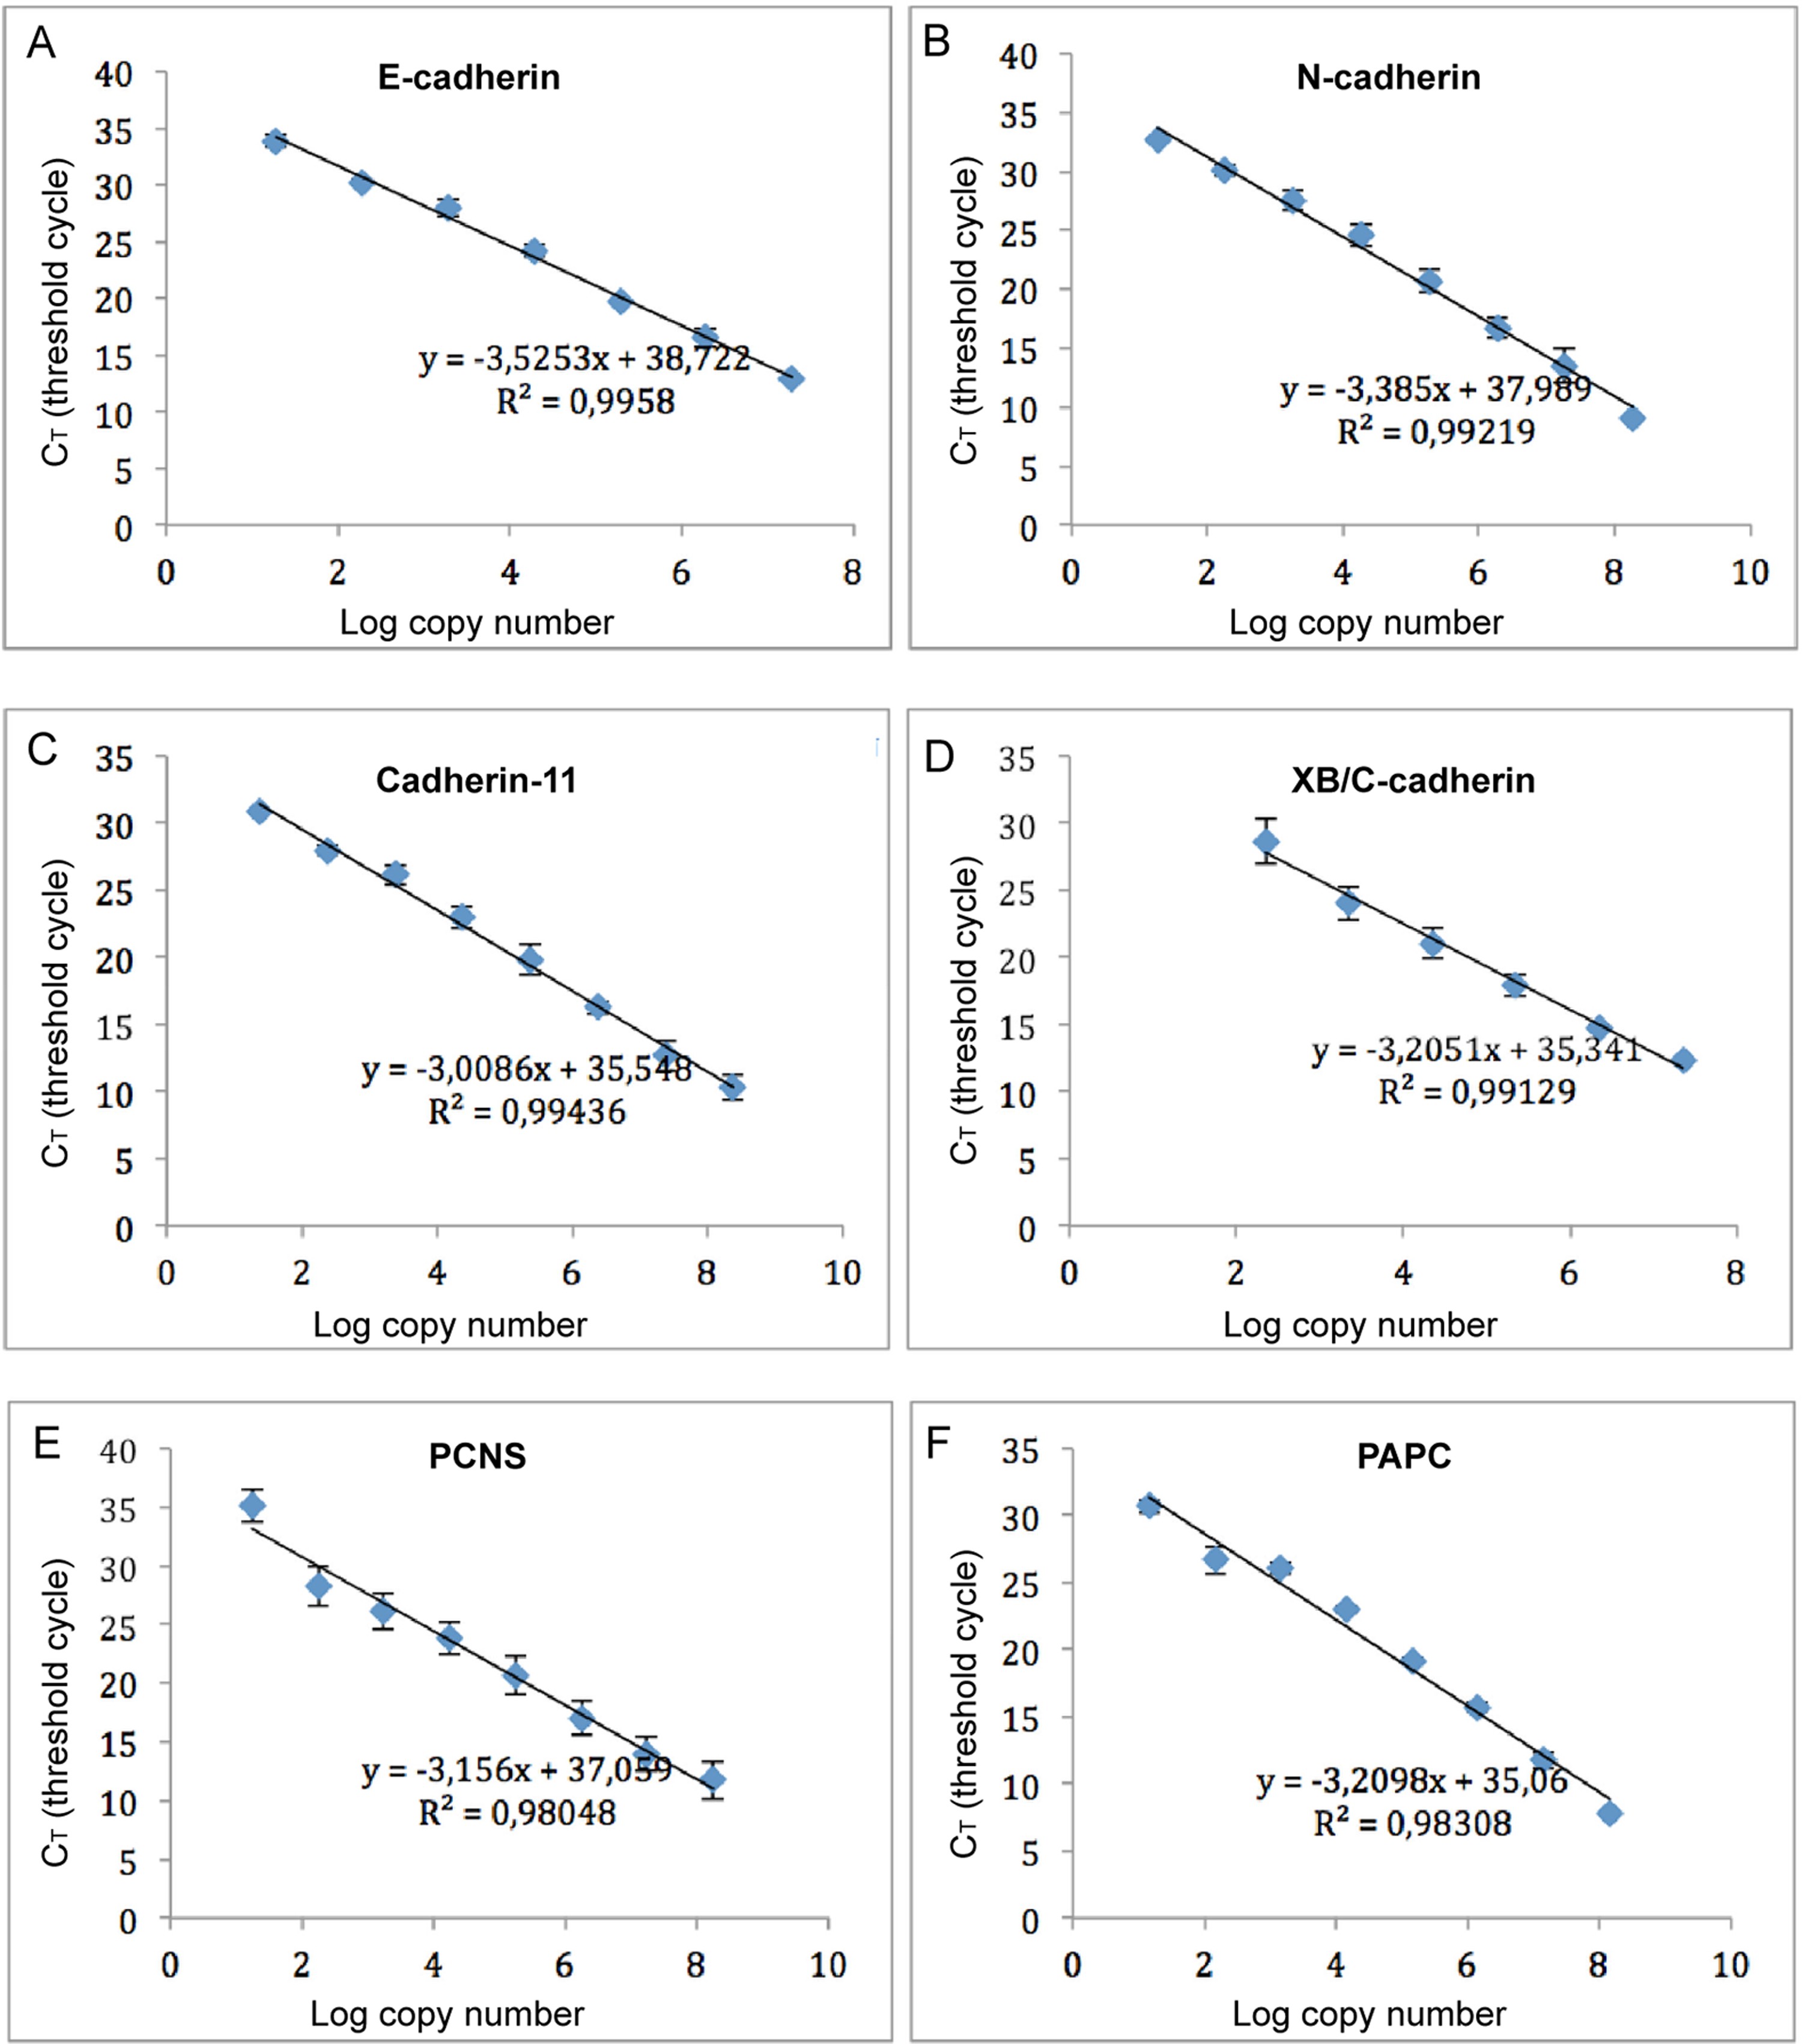
Fig. S2. Standard curves of different cadherins used for absolute quantification analysis. Standard curves for (A) E-cadherin, (B) N-cadherin, (C) Cadherin-11, (D) XB/C-cadherin, (E) PCNS and (F) PAPC, respectively. The standard curves were calculated with serial 10-fold dilutions of the plasmid DNA, ranging from 10 to 1 à 108 copies/μl. Each standard dilution was amplified by RT-qPCR using validated primers in triplicates. For each gene, the determined CT values were plotted against the logarithm of their calculated initial copy numbers. Independent serial dilutions of the standards were repeated at least three times for each dilution and the mean value with standard deviation is shown. A standard curve was generated by linear regression through the points representing the mean values. The equation for the regression line and the correlation coefficient (R2) are shown above the graph. The equation was used to determine the starting quantity of the test sample from the experimental CT values.
Image published in: Huang C et al. (2016)
Copyright © 2016. Image reproduced with permission of the Publisher, Elsevier B. V.
Permanent Image Page
Printer Friendly View
XB-IMG-149677