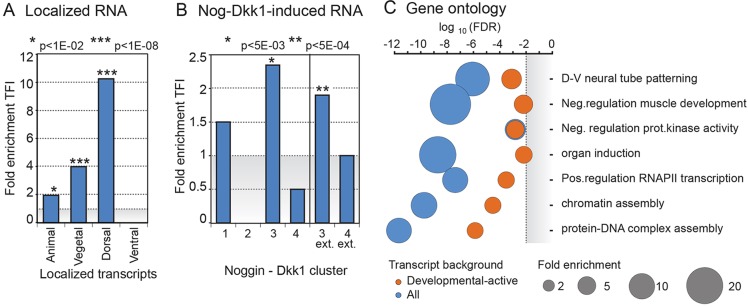
Fig. 3. Characterization of TFI gene transcript localization and function. (A) Over-representation (fold enrichment) of TFI gene transcripts among localized expression in the animal, vegetal, dorsal and ventral parts of the embryo. TFI transcripts are not over-represented among ventrally expressed transcripts. Hypergeometric P-values are indicated. (B) Over-representation of TFI gene transcripts within four clusters of genes identified after ectopic induction of the organizer by Noggin (Nog) and Dickkopf-1 (Dkk1). Clusters 3 and 3-extended represent organizer genes (Hufton et al., 2006). TFI gene transcripts are moderately but significantly over-represented in these clusters. (C) Gene ontology (GO) term analysis of TFI genes relative to GO terms in all genes (blue) or in developmentally active genes (orange, defined as in Fig. 1D). The GO fold enrichments are reflected in the sizes of the circles (see scale in gray). Significance (FDR; top) and relevant GO terms (right) are indicated.
Image published in: Gazdag E et al. (2016)
© 2016. Creative Commons Attribution license
Permanent Image Page
Printer Friendly View
XB-IMG-151529