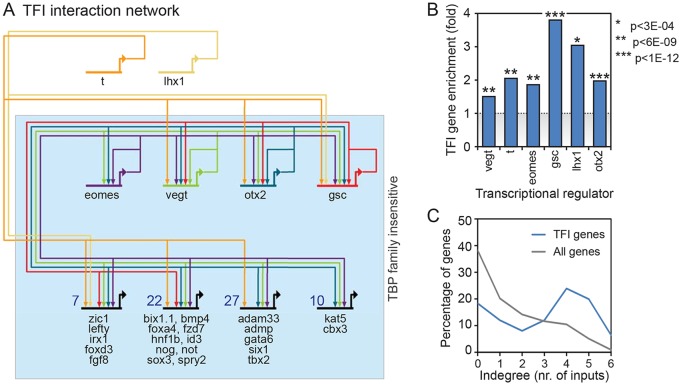
Fig. 6. TFI network analysis. (A) TFI genomic interaction network (blue box) based on ChIP data of Otx2, Vegt, Eomes, Gsc, T and Lhx1 in X. tropicalis. The most common binding combinations with representative TFI genes are depicted on the bottom row. The total number of TFI genes with the same binding combinations is indicated. For a complete overview, see Fig. S4. (B) Over-representation of TFI genes among genes bound by Otx2, Vegt, Eomes, Gsc, T and Lhx1. Hypergeometric P-values are indicated. (C) Indegree (number of inputs) of TFI gene transcripts (blue) and all genes (gray). TFI gene transcripts are often bound by four or more of the transcription factors Otx2, Vegt, Eomes, Gsc, T and Lhx1.
Image published in: Gazdag E et al. (2016)
© 2016. Creative Commons Attribution license
Permanent Image Page
Printer Friendly View
XB-IMG-151532