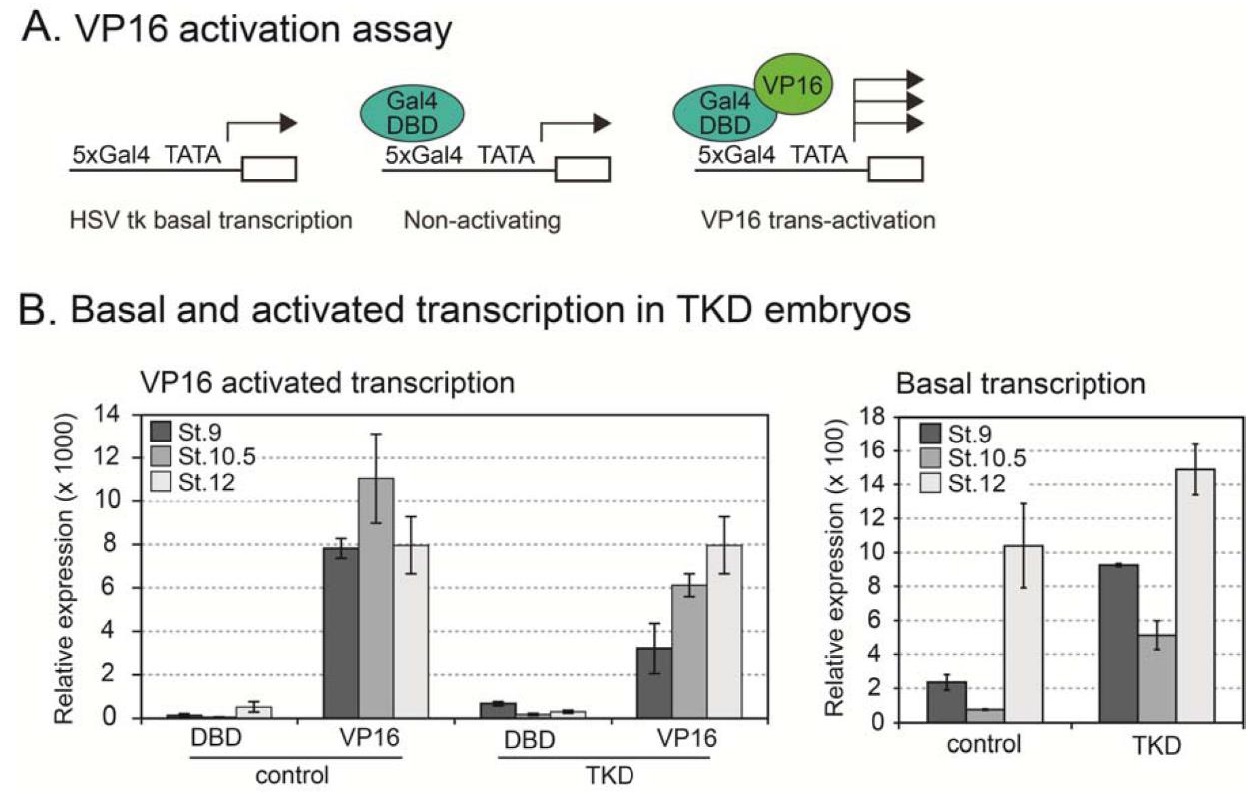
Supplemental Figure S3. VP16 transcription activation assay combined with TBP family loss‐of‐function experiments. See Fig. 5A for ChIP analysis in the assay system. (A) Schematic overview of VP16 assay. (B) Transcription in non‐activating and VP16‐activated conditions (left panel) and basal levels of transcription (right panel) are compared in TBP family triple knockdown (TKD) and control embryos. Embryos were staged according to the morphology of control embryos. Stages of 9, 10.5 and 12 were collected for analysis.
Image published in: Gazdag E et al. (2016)
© 2016. Creative Commons Attribution license
Permanent Image Page
Printer Friendly View
XB-IMG-152371